Seite wählen

NETWAYS Blog

NETWAYS‘ Upcoming Training #Summer2018

Our Open Source trainings are designed to support your modern business processes

New Ways with NETWAYS – Our goal is to design your learning process as comfortable as possible! 


Foreman – Life Cycle Management for Servers
2 days training sessions | 03.07.2018 to 04.07.2018
CEPH – Scale out Storage
2 days training sessions | 03.07.2018 to 04.07.2018
GitLab – Modern Software Development
2 days training sessions | 10.07.2018 to 11.07.2018
Icinga 2 Fundamentals – Monitoring Redesigned
4 days training sessions | 10.07.2018 to 13.07.2018
Bareos – Level 1 – Introduction to Bareos
3 days training sessions | 16.07.2018 to 18.07.2018
Graylog training – Centralized Logfile Management
2 days training sessions | 17.07.2018 to 18.07.2018
Bareos – Level 2  – Backup with LTO
2 days training sessions | 19.07.2018 to 20.07.2018
Ansible  Configuration Management
2 days training sessions | 24.07.2018 to 25.07.2018
Ansible AWX (Tower) 
1 day training session | 26.07.2018


For the whole NETWAYS training schedule visit: netways.de/training. For assistance please contact us.

Keya Kher
Keya Kher
Marketing Specialist

Keya ist seit Oktober 2017 in unserem Marketing Team. Nach ihrer Elternzeit ist sie seit Februar 2024 wieder zurĂĽck, um sich speziell um Icinga-Themen zu kĂĽmmern. Wenn sie sich nicht kreativ auslebt, entdeckt sie andere Städte oder schmökert in einem Buch. Ihr Favorit ist “The Shiva Trilogy”.  

Elastic{ON} 2018 Reisebericht und RĂĽckblick

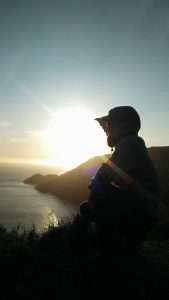
Wie alle guten Weine brauch auch manchmal ein Erlebnis eine Weile um zu einer guten Erfahrung zu reifen. So war es für mich mit der Elastic{ON} 2018 und passend zum Feiertag hole ich für euch nun unsere Review aus dem Keller, öffne die Flasche und wir schauen gemeinsam zurück auf das Event.
Thomas Widhalm und ich waren  für NETWAYS bei der Elasti{CON}2018 für euch vor Ort und haben uns die neuesten Entwicklungen und Best Practice Geschichten für euch angehört.


Keynote und Party

Die Keynote gefĂĽhrt von GrĂĽnder Shay Banon ging schon spannend los, nach dem wir von unzähligen Mitarbeitern in einem Intro begrĂĽĂźt wurden, folgten fĂĽr alle Produkte des Elastic Stacks kurze Feature Vorstellungen fĂĽrs nächste Release. Highlight dieser Keynote war der Vortrag von Ryan Kazanciyan der technische Consultant fĂĽr die Serie Mr. Robot. Eine weitere groĂźe AnkĂĽndigung war mit Abstand die „Doubling down on open“ Strategie, welche eine Veröffentlichung der Quellen des X-Pack  mit sich bringt. Dies bedeutet aber nicht das diese Quellen unter eine Open Source Lizenz gestellt werden. Hierzu gab es noch einen Nachruf von Philipp Krenn im Elastic Blog, denn dieses Thema sorgte fĂĽr viel Diskussionsstoff und hinterlieĂź zuerst einige Unklarheiten.
Bei der Anschließenden Keynote-Party ging es spielerisch mit Frischlufteinlage zu. Denn der Feueralarm ertönte als die Party im vollen Gange war und wir mussten das Gebäude kurzfristig verlassen. Für alle die uns kennen, soll gesagt sein, Thomas und ich hatten damit nichts zu tun.


1 Konferenztag

Am ersten Konferzenz-Tag haben Thomas und ich uns auf die unterschiedlichen Sessions verteilt. Thomas Schwerpunkt lag am ersten Tag hier auf den Talks zu den einzelnen Tools des Stacks und deren neuen Features, während ich mich auf Best Practice und BoF (Birth of Feather) Sessions konzentriert.
Die hier spannendste BoF Session war die zur GDPR welche zum 25.Mai 2018 in kraft tritt. Hier wurde in einer großen Runde darüber diskutiert wie man im Bezug auf Logmanagement und das Auswerten von Logingdaten zu reagieren hat. Klar ist das es einige Möglichkeiten gibt mit denen die sensiblen Daten wie eine IP mit dem Fingerprint Filter gehasht werden können. Aber auch die Auflagen zur Absicherung des Zugangs zu den Daten und deren Aufbewahrungszeiten gilt es zu berücksichtigen. Zu dieser Session findet sich im Elastic Blog eine sehr gute Zusammenfassung.
Thomas konnte fĂĽr uns einen sehr guten Ăśberblick ĂĽber die Neuerungen im Stack am ersten Tag gewinnen. Da diese nicht gerade wenig sind, haben wir hier fĂĽr euch kurz zu jedem Tool drei Punkte:

Elasticsearch

  • Cross-Cluster Search ersetzt vollständig die Tribe Node Funktion, die Tribe Node Funktion wurde entfernt. Mit einem Node als Cross-Cluster-Node ist das verbinden mehrere Cluster und der Darstellung der Cluster-Daten in einem zentralen Kibana möglich. Wichtig dabei ist, dass laut Plan drei Major Versions in einem Verbund unterstĂĽtzt werden. Diese Funktion kann unter anderem sehr nĂĽtzlich bei Migrationen und Upgrade-Szenarien sein.
  • „Cross-Cluster-Sync“, wodurch Daten zwischen Clustern synchronisiert werden können. Damit können Daten in verschiedenen Standorten synchron gehalten werden ohne einen Cluster ĂĽber mehrere Rechenzentren zu spannen (was nicht supported wird)
  • Die Angabe von minimum master nodes um Split Brain zu verhinden wird automatisch werden. Wie und wie die eingestellt werden kann wurde noch nicht genau gezeigt.

Kibana

  • Mit X-Pack gibt’s mehr Authentifizierungsbackends (inkl. SAML)
  • Query Autocompletion kommt
  • KQL wird die neue Querysprache, als Ersatz fĂĽr die Lucene Query Syntax. Die beiden ähneln sich aber stark.
  • Neue Visualisierung: Waffle Map und Canvas sollen kommen

Beats

  • Es kommt eine Prometheus Integration
  • Auditbeat bekommt neue Features. Wird damit eine Kombination aus Auslesen von auditd plus Aide.
  • Beats senden jetzt eine Art Heartbeat, in dem auch ein paar Eckdaten des Hosts, auf dem sie installiert sind enthalten sind. So hat man ein rudimentäres Monitoring in Kibana und sieht auch gleich, ob alle Beats aktiv sind.

Logstash

  • Mit X-Pack soll ein Konfigmanagement fĂĽr mehrere Logstash Instanzen inkl. Konfiguration von Pipelines kommen.
  • Logstash erhält einen Secret Key Store, mit dem Passwörter fĂĽr Verbindungen sicher gespeichert werden können
  • Visual Pipeline Builder, mit dem in Kibana abgebildet wird, wie die Pipeline konfiguriert sind.

Party

Wer uns von NETWAYS kennt weis, dass wir immer gerne Feiern. Am Abend des ersten Tages waren wir zur Party von unseren Freunden von Graylog geladen. Ebenfalls eine Software fĂĽr das Logmanagement welche unter anderem auch Elastic Software nutzt, wie zum Beispiel Elasticsearch zum speichern der Dokumente.


2 Konferenztag

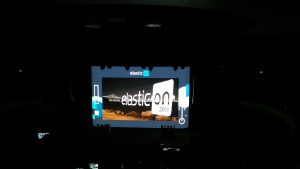
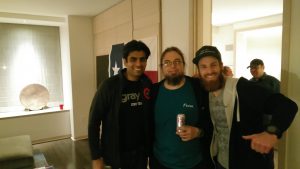
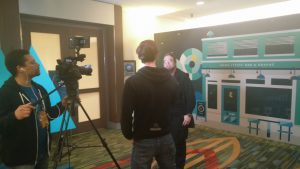
Am zweiten Konferenztag waren wir überwiegend gemeinsam Unterwegs und durften uns über die Überklimatisierung der Räume erfreuen, welche für Eiszeiten sorgte. An diesem Tag nahmen Thomas und ich an einer Videostory teil, welche bis jetzt wohl noch nicht veröffentlich ist.
 

Talks

Der Talk der an diesem Tag fĂĽr Thomas und mich besonders erwähnenswert war, war der Talk „The seven deadly Sins of Elasticsearch Benchmarking„.  In diesem Talk gaben Elastic Mitarbeiter aus der Entwicklung Einsicht in Ihre Erfahrung aus dem täglichen Elastisearch Support und wie Sie Elasticsearch zu Performance verhelfen. Klare Empfehlung ist immer auf der gleichen Infrastruktur zu testen wie diese in Produktion verwendet wird. Ein wichtiges Werkzeug fĂĽr das Testen von Elasticsearch-Clustern wurde vorgestellt und auf Github zu finden https://github.com/elastic/rally.

Unsere Entdeckung

Unser Blerim Sheqa alias bobapple ist auf der „Thank you to the Contributors wall“ fĂĽr seine Beats verewigt!YEAHY!

Schön wars…

Es war insgesamt eine sehr gute Konferenz welche uns sehr viele Erfahrungsmehrwerte verschaffte und uns die Möglichkeit bot eine Zertifizierung einzufahren. Thomas und ich bedanken uns auch bei Bernd bedanken, dass wir unsere Firma vertreten durften.
Mein persönliches Highlight war wohl der AMA-Stand. Diese Chance mit den Schöpfern und den Supportern der Software direkt zu sprechen nehme ich gerne war um meine offenen Verständnisfragen zum Elastic Stack zu schlieĂźen und nicht eine konkrete Aufgabenstellung zu lösen. Jetzt bleibt nur noch zu sagen das wir von neuem Wissen und mehr Wissen nur so strotzen und wenn Ihr offene Fragen habt dann besucht doch einfach eine unserer Elastic Stack Trainings z.b  Anfang Juni. Oder meldet euch, wenn Ihr konkret UnterstĂĽtzung braucht und von unserem mit neuen Informationen angereicherten Wissen profitieren wollt, bei den Kollegen vom Sales Team. So zum Abschied noch eine kleine Weisheit : „You Know for Search!“

Daniel Neuberger
Daniel Neuberger
Senior Consultant

Nach seiner Ausbildung zum Fachinformatiker für Systemintegration und Tätigkeit als Systemadministrator kam er 2012 zum Consulting. Nach nun mehr als 4 Jahren Linux und Open Source Backup Consulting zieht es ihn in die Welt des Monitorings und System Management. Seit April 2017 verstärkt er das NETWAYS Professional Services Team im Consulting rund um die Themen Elastic, Icinga und Bareos. Wenn er gerade mal nicht um anderen zu Helfen durch die Welt tingelt geht er seiner Leidenschaft für die Natur beim Biken und der Imkerei nach und kassiert dabei schon mal einen Stich.

Hackathon auf der OSMC

Nachdem bis auf Ansible alle unsere Workshops bereits ausgebucht sind, kann die OSMC nicht mehr lange hin sein! Wohl wahr, in gut einem Monat geht’s schon los.
Und nun steht auch das Programm für den perfekten Konferenzausklang am Hackathon-Freitag. Fünf Themen haben wir ausgewählt, wir freuen uns natürlich auch über eure eigenen Vorschläge! Lasst euch diesen spannenden Hacker-Tag nicht entgehen und tüftelt mit Gleichgesinnten!
Das Programm steht auch schon länger fest, mit dabei sind unter anderem diese Highlights:

Die Workshops sind bis auf „Ansible – Configuration Management“ schon restlos ausgebucht. Wer hier noch teilnehmen will, sollte also nicht lange zögern, sondern schnell klicken.
Alles weitere zur Konferenz findet ihr wie immer brandaktuell auf unserer Webseite!

Secure Elasticsearch and Kibana with an Nginx HTTP Proxy

Elasticsearch provides a great HTTP API where applications can write to and read from in high performance environments. One of our customers sponsored a feature for Icinga 2 which writes events and performance data metrics to Elasticsearch. This will hit v2.8 later this year.
We’re also concerned about security, and have been looking into security mechanisms such as basic auth or TLS. Unfortunately this isn’t included in the Open Source stack.
 

Why should you care about securing Elasticsearch and Kibana?

Modern infrastructure deployments commonly require Elasticsearch listening on an external interface and answering HTTP requests. Earlier this year we’ve learned about ransomware attacks on MongoDB and Elasticsearch too.
During development I’ve found this API call – just clear everything inside the database.

[root@icinga2-elastic ~]# curl -X DELETE http://localhost:9200/_all
{"acknowledged":true}

I don’t want any user to run this command from anywhere. You can disable this by setting „action.destructive_requires_name“ to „true“ inside the configuration, but it is not the default.
A similar thing is that you can read and write anything without any access rules in place, no matter if querying Elasticsearch or Kibana directly.
 

Firewall and Network Segments

A possible solution is to limit the network transport to only allowed hosts via firewall rules and so on. If your Elasticsearch cluster is running on a dedicated VLAN, you would need to allow the Icinga 2 monitoring host to write data into – anyone on that machine could still read/write without any security mechanism in place.
 

HTTP Proxy with Nginx

Start with the plain proxy pass configuration and forward http://localhosT:9200 to your external interface (192.168.33.7 in this example).

# MANAGED BY PUPPET
server {
  listen       192.168.33.7:9200;
  server_name  elasticsearch.vagrant-demo.icinga.com;
  index  index.html index.htm index.php;
  access_log            /var/log/nginx/ssl-elasticsearch.vagrant-demo.icinga.com.access.log combined;
  error_log             /var/log/nginx/ssl-elasticsearch.vagrant-demo.icinga.com.error.log;
  location / {
    proxy_pass            http://localhost:9200;
    proxy_read_timeout    90;
    proxy_connect_timeout 90;
    proxy_set_header      Host $host;
    proxy_set_header      X-Real-IP $remote_addr;
    proxy_set_header      X-Forwarded-For $proxy_add_x_forwarded_for;
    proxy_set_header      Proxy "";
  }
}

Restart Nginx and test the connection from the external interface.

# systemctl restart nginx
# curl -v http://192.168.33.7:9200

Once this is working, proceed with adding basic auth and TLS.
 

HTTP Proxy with Basic Auth

This leverages the access level to authenticated users only. Best is to manage the basic auth users file with Puppet, Ansible, etc. – similar to how you manage your Nginx configuration. Our consultants use that method on a regular basis, and provided me with some examples for Nginx. You could do the same for Apache – I would guess that is a matter of taste and performance here.
Generate a username/password combination e.g. using the htpasswd CLI command.

htpasswd -c /etc/nginx/elasticsearch.passwd icinga

Specify the basic auth message and the file which contains the basic auth users.

    auth_basic                "Elasticsearch auth";
    auth_basic_user_file      "/etc/nginx/elasticsearch.passwd";

Restart Nginx and connect to the external interface.

# systemctl restart nginx
# curl -v -u icinga:icinga http://192.168.33.7:9200


HTTP Proxy with TLS

The Elasticsearch HTTP API does not support TLS out-of-the-box. You need to enforce HTTPS via HTTP Proxy, enable ssl and set up the required certificates.
Enforce the listen address to SSL only. That way http won’t work.

  listen       192.168.33.7:9200 ssl;

Enable SSL, specify the certificate paths on disk, use TLSv1 and above and optionally secure the used ciphers.

  ssl on;
  ssl_certificate           /etc/nginx/certs/icinga2-elastic.crt;
  ssl_certificate_key       /etc/nginx/certs/icinga2-elastic.key;
  ssl_session_cache         shared:SSL:10m;
  ssl_session_timeout       5m;
  ssl_protocols             TLSv1 TLSv1.1 TLSv1.2;
  ssl_ciphers               ECDHE-ECDSA-CHACHA20-POLY1305:ECDHE-RSA-CHACHA20-POLY1305:ECDHE-ECDSA-AES128-GCM-SHA256:ECDHE-RSA-AES128-GCM-SHA256:ECDHE-ECDSA-AES256-GCM-SHA384:ECDHE-RSA-AES256-GCM-SHA384:DHE-RSA-AES128-GCM-SHA256:DHE-RSA-AES256-GCM-SHA384:ECDHE-ECDSA-AES128-SHA256:ECDHE-RSA-AES128-SHA256:ECDHE-ECDSA-AES128-SHA:ECDHE-RSA-AES256-SHA384:ECDHE-RSA-AES128-SHA:ECDHE-ECDSA-AES256-SHA384:ECDHE-ECDSA-AES256-SHA:ECDHE-RSA-AES256-SHA:DHE-RSA-AES128-SHA256:DHE-RSA-AES128-SHA:DHE-RSA-AES256-SHA256:DHE-RSA-AES256-SHA:ECDHE-ECDSA-DES-CBC3-SHA:ECDHE-RSA-DES-CBC3-SHA:EDH-RSA-DES-CBC3-SHA:AES128-GCM-SHA256:AES256-GCM-SHA384:AES128-SHA256:AES256-SHA256:AES128-SHA:AES256-SHA:DES-CBC3-SHA:!DSS;
  ssl_prefer_server_ciphers on;
  ssl_trusted_certificate   /etc/nginx/certs/ca.crt;

Restart Nginx and connect to the external interface on https. Note: Host verification is disabled in this example.

# systemctl restart nginx
# curl -v -k -u icinga:icinga https://192.168.33.7:9200


Combine HTTP Proxy, TLS and Basic Auth

A complete configuration example could look like this:

vim /etc/nginx/sites-enabled/elasticsearch.vagrant-demo.icinga.com.conf
# MANAGED BY PUPPET
server {
  listen       192.168.33.7:9200 ssl;
  server_name  elasticsearch.vagrant-demo.icinga.com;
  ssl on;
  ssl_certificate           /etc/nginx/certs/icinga2-elastic.crt;
  ssl_certificate_key       /etc/nginx/certs/icinga2-elastic.key;
  ssl_session_cache         shared:SSL:10m;
  ssl_session_timeout       5m;
  ssl_protocols             TLSv1 TLSv1.1 TLSv1.2;
  ssl_ciphers               ECDHE-ECDSA-CHACHA20-POLY1305:ECDHE-RSA-CHACHA20-POLY1305:ECDHE-ECDSA-AES128-GCM-SHA256:ECDHE-RSA-AES128-GCM-SHA256:ECDHE-ECDSA-AES256-GCM-SHA384:ECDHE-RSA-AES256-GCM-SHA384:DHE-RSA-AES128-GCM-SHA256:DHE-RSA-AES256-GCM-SHA384:ECDHE-ECDSA-AES128-SHA256:ECDHE-RSA-AES128-SHA256:ECDHE-ECDSA-AES128-SHA:ECDHE-RSA-AES256-SHA384:ECDHE-RSA-AES128-SHA:ECDHE-ECDSA-AES256-SHA384:ECDHE-ECDSA-AES256-SHA:ECDHE-RSA-AES256-SHA:DHE-RSA-AES128-SHA256:DHE-RSA-AES128-SHA:DHE-RSA-AES256-SHA256:DHE-RSA-AES256-SHA:ECDHE-ECDSA-DES-CBC3-SHA:ECDHE-RSA-DES-CBC3-SHA:EDH-RSA-DES-CBC3-SHA:AES128-GCM-SHA256:AES256-GCM-SHA384:AES128-SHA256:AES256-SHA256:AES128-SHA:AES256-SHA:DES-CBC3-SHA:!DSS;
  ssl_prefer_server_ciphers on;
  ssl_trusted_certificate   /etc/nginx/certs/ca.crt;
  uth_basic                "Elasticsearch auth";
  auth_basic_user_file      "/etc/nginx/elasticsearch.passwd";
  index  index.html index.htm index.php;
  access_log            /var/log/nginx/ssl-elasticsearch.vagrant-demo.icinga.com.access.log combined;
  error_log             /var/log/nginx/ssl-elasticsearch.vagrant-demo.icinga.com.error.log;
  location / {
    proxy_pass            http://localhost:9200;
    proxy_read_timeout    90;
    proxy_connect_timeout 90;
    proxy_set_header      Host $host;
    proxy_set_header      X-Real-IP $remote_addr;
    proxy_set_header      X-Forwarded-For $proxy_add_x_forwarded_for;
    proxy_set_header      Proxy "";
  }
}

The following example query does not verify the offered host certificate. In case you configure the ElasticWriter feature in Icinga 2 v2.8, you’ll find the options to specify certificates for TLS handshake verification.

$ curl -v -k -u icinga:icinga https://192.168.33.7:9200
* Rebuilt URL to: https://192.168.33.7:9200/
*   Trying 192.168.33.7...
* TCP_NODELAY set
* Connected to 192.168.33.7 (192.168.33.7) port 9200 (#0)
* WARNING: disabling hostname validation also disables SNI.
* TLS 1.2 connection using TLS_ECDHE_RSA_WITH_AES_128_GCM_SHA256
* Server certificate: icinga2-elastic
* Server auth using Basic with user 'icinga'
> GET / HTTP/1.1
> Host: 192.168.33.7:9200
> Authorization: Basic aWNpbmdhOmljaW5nYQ==
> User-Agent: curl/7.54.0
> Accept: */*
>
< HTTP/1.1 200 OK
< Server: nginx/1.12.1
< Date: Tue, 12 Sep 2017 13:52:31 GMT
< Content-Type: application/json; charset=UTF-8
< Content-Length: 340
< Connection: keep-alive
<
{
  "name" : "icinga2-elastic-elastic-es",
  "cluster_name" : "elastic",
  "cluster_uuid" : "axUBwxpFSpeFBmVRD6tTiw",
  "version" : {
    "number" : "5.5.2",
    "build_hash" : "b2f0c09",
    "build_date" : "2017-08-14T12:33:14.154Z",
    "build_snapshot" : false,
    "lucene_version" : "6.6.0"
  },
  "tagline" : "You Know, for Search"
}
* Connection #0 to host 192.168.33.7 left intact


Conclusion

Secure data transfer from your monitoring instances to Elasticsearch is mandatory. Basic access control via basic auth should also be implemented. All of this is possible with the help of a dedicated HTTP Proxy host. Fine granular access control for specific HTTP requests is available in the commercial Shield package or variants. While securing Elasticsearch, also look into Kibana which runs on port 5601.
Since we’ve used the Icinga Vagrant boxes as a development playground, I’ve added Nginx as HTTP Proxy inside the icinga2x-elastic box. This provisions the required basic auth and TLS settings and offers to write data on https://192.168.33.7:9200 (icinga/icinga). The same applies for Kibana. The examples above can be replayed too.
If you want to learn more on this topic, make sure to join our Elastic Stack training sessions or kindly invite one of our consultants for a hands-on workshop. Hint: There is an Elastic Stack workshop at OSMC too 🙂

Manage Elasticsearch, Kibana & icingabeat with Puppet

A while back I’ve already looked into the Elastic Stack 5 Beta release and the beats integration. Time flies and the stable release is here. Blerim announced the icingabeat 1.0.0 release last week, and so I was looking into a smooth integration into a Vagrant box here.
The provisioner uses Puppet, which Puppet modules could be used here? I’m always looking for actively maintained modules, best by upstream projects which share the joy of automated setups of their tools with their community.
 

Elastic and Kibana Puppet Module

The Elastic developers started writing their own Puppet module for Kibana 5.x. Previously I’ve used community modules such as puppet-kibana4 or puppet-kibana5. puppet-elasticsearch already supports 5.x for a while, that works like a charm.
Simple example for a low memory Elasticsearch setup:

class { 'elasticsearch':
  manage_repo  => true,
  repo_version => '5.x',
  java_install => false,
  jvm_options => [
    '-Xms256m',
    '-Xmx256m'
  ],
  require => Class['java']
} ->
elasticsearch::instance { 'elastic-es':
  config => {
    'cluster.name' => 'elastic',
    'network.host' => '127.0.0.1'
  }
}

Note: jvm_options was released in 5.0.0.
 

Default index pattern

If you do not define any default index pattern, Kibana greets you with a fancy message to do so (and I have to admit – i still need an Elastic Stack training to fully understand why). I wanted to automate that, so that Vagrant box users don’t need to care about it. There are several threads around which describe the deployment by sending a PUT request to the Elasticsearch backend.
I’m using a small script here which waits until Elasticsearch is started. If you don’t do that, the REST API calls will fail later on. This is also required for specifying index patterns and importing dashboards. A Puppet exec timeout won’t do the trick here, because we’ll have to loop and check again if the service is available.

$ cat/usr/local/bin/kibana-setup
#!/bin/bash
ES_URL="http://localhost:9200"
TIMEOUT=300
START=$(date +%s)
echo -e "Restart elasticsearch instance"
systemctl restart elasticsearch-elastic-es
echo -e "Checking whether Elasticsearch is listening at $ES_URL"
until $(curl --output /dev/null --silent $ES_URL); do
  NOW=$(date +%s)
  REAL_TIMEOUT=$(( START + TIMEOUT ))
  if [[ "$NOW" -gt "$REAL_TIMEOUT" ]]; then
    echo "Cannot reach Elasticsearch at $ES_URL. Timeout reached."
    exit 1
  fi
  printf '.'
  sleep 1
done

If you would want to specify the default index pattern i.e. for an installed filebeat service, you could something like this:

ES_INDEX_URL="$ES_URL/.kibana/index-pattern/filebeat"
ES_DEFAULT_INDEX_URL="$ES_URL/.kibana/config/5.2.2" #hardcoded program version
curl -XPUT $ES_INDEX_URL -d '{ "title":"filebeat", "timeFieldName":"@timestamp" }'
curl -XPUT $ES_DEFAULT_INDEX_URL -d '{ "defaultIndex":"filebeat" }'

One problem arises: The configuration is stored by Kibana program version. There is no symlink like ‚latest‘, but you’ll need to specify ‚.kibana/config/5.2.2‘ to make it work. There is a certain requirement for pinning the Kibana version, or finding a programatic way to automatically determine the version.
 

Kibana Version in Puppet

Fortunately the Puppet module allows for specifying a version. Turns out, the class validation doesn’t support package revision known from rpm („5.2.2-1“). Open source is awesome – you manage to patch it, apply tests and after review your contributed patch gets merged upstream.
Example for Kibana with a pinned package version:

$kibanaVersion = '5.2.2'
class { 'kibana':
  ensure => "$kibanaVersion-1",
  config => {
    'server.port' => 5601,
    'server.host' => '0.0.0.0',
    'kibana.index' => '.kibana',
    'kibana.defaultAppId' => 'discover',
    'logging.silent'               => false,
    'logging.quiet'                => false,
    'logging.verbose'              => false,
    'logging.events'               => "{ log: ['info', 'warning', 'error', 'fatal'], response: '*', error: '*' }",
    'elasticsearch.requestTimeout' => 500000,
  },
  require => Class['java']
}
->
file { 'kibana-setup':
  name => '/usr/local/bin/kibana-setup',
  owner => root,
  group => root,
  mode => '0755',
  source => "puppet:////vagrant/files/usr/local/bin/kibana-setup",
}
->
exec { 'finish-kibana-setup':
  path => '/bin:/usr/bin:/sbin:/usr/sbin',
  command => "/usr/local/bin/kibana-setup",
  timeout => 3600
}


Icingabeat integration

That’s fairly easy, just install the rpm and put a slightly modified icingabeat.yml there.

$icingabeatVersion = '1.0.0'
yum::install { 'icingabeat':
  ensure => present,
  source => "https://github.com/Icinga/icingabeat/releases/download/v$icingabeatVersion/icingabeat-$icingabeatVersion-x86_64.rpm"
}->
file { '/etc/icingabeat/icingabeat.yml':
  source    => 'puppet:////vagrant/files/etc/icingabeat/icingabeat.yml',
}->
service { 'icingabeat':
  ensure => running
}

I’ve also found the puppet-archive module from Voxpupuli which allows to download and extract the required Kibana dashboards from icingabeat. The import then requires that Elasticsearch is up and running (referencing the kibana setup script again). You’ll notice the reference to the pinned Kibana version for setting the default index pattern via exec resource.

# https://github.com/icinga/icingabeat#dashboards
archive { '/tmp/icingabeat-dashboards.zip':
  ensure => present,
  extract => true,
  extract_path => '/tmp',
  source => "https://github.com/Icinga/icingabeat/releases/download/v$icingabeatVersion/icingabeat-dashboards-$icingabeatVersion.zip",
  checksum => 'b6de2adf2f10b77bd4e7f9a7fab36b44ed92fa03',
  checksum_type => 'sha1',
  creates => "/tmp/icingabeat-dashboards-$icingabeatVersion",
  cleanup => true,
  require => Package['unzip']
}->
exec { 'icingabeat-kibana-dashboards':
  path => '/bin:/usr/bin:/sbin:/usr/sbin',
  command => "/usr/share/icingabeat/scripts/import_dashboards -dir /tmp/icingabeat-dashboards-$icingabeatVersion -es http://127.0.0.1:9200",
  require => Exec['finish-kibana-setup']
}->
exec { 'icingabeat-kibana-default-index-pattern':
  path => '/bin:/usr/bin:/sbin:/usr/sbin',
  command => "curl -XPUT http://127.0.0.1:9200/.kibana/config/$kibanaVersion -d '{ \"defaultIndex\":\"icingabeat-*\" }'",
}

The Puppet code is the first working draft, I plan to refactor the upstream code. Look how fancy 🙂

Conclusion

Managing your Elastic Stack setup with Puppet really has become a breeze. I haven’t tackled the many plugins and dashboards available, there’s so much more to explore. Once you’ve integrated icingabeat into your devops stack, how would you build your own dashboards to correlate operations maintenance with Icinga alerts? 🙂
If you’re interested in learning more about Elastic and the awesome Beats integrations, make sure to join OSDC 2017. Monica Sarbu joins us with her talk on „Collecting the right data to monitor your infrastructure“.
PS: Test-drive the integration, finished today 🙂

Test-drive #icingabeat inside the #icinga vagrant box 'icinga2x-elastic' 🙂 https://t.co/DJuThyy6uu #elastic pic.twitter.com/qH1Kt8NB1l

— Icinga (@icinga) March 30, 2017