Seite wählen

NETWAYS Blog

May I introduce the Rubocop

When you are into developing Ruby code, or even Ruby near stuff like Puppet modules, or Chef cookbooks, there is a nice tool you should have a look at.
The RuboCop can help you writing better Ruby code, it certainly did it for me.
In short words, RubyCop is a code analyzer that checks Ruby code against common style guidelines and tries to detect a lot of mistakes and errors that you might write into your code.
There are a lot of configuration options, and even an auto-correct functionality, that updates your code.

Simple usage

Either install the gem, or add it to your Gemfile:

gem 'rubocop', require: false

You can just run it without configuration, and it will look for all Ruby files in your work directory.

$ rubocop
Inspecting 19 files
....C............CC
Offenses:
lib/test/cli.rb:3:3: C: Missing top-level class documentation comment.
 class CLI
 ^^^^^
lib/test/cli.rb:36:1: C: Extra empty line detected at method body beginning.
lib/test/cli.rb:41:1: C: Extra empty line detected at block body beginning.
lib/test/cli.rb:45:4: C: Final newline missing.
end
bin/test:12:1: C: Missing space after #.
#api.login('username', 'Passw0rd') unless api.logged_in?
^^^^^^^^^^^^^^^^^^^^^^^^^^^^^^^^^^^^^^^^^^^^^^^^^^^^^^^^
bin/test:15:3: C: Missing space after #.
 #puts response.code
 ^^^^^^^^^^^^^^^^^^^
bin/test:19:1: C: Missing space after #.
#session.save(file)
^^^^^^^^^^^^^^^^^^^
18 files inspected, 7 offenses detected

You can add it as a rake job to your Rakefile:

require 'rubocop/rake_task'
RuboCop::RakeTask.new
task default: [:spec, :rubocop]

And run the test via your rake tests:

$ rake
$ rake rubocop

Configuration galore

There are a lot of options to modify the behavior and expectations of RuboCop.
Here is a short example I used with recent Puppet module.

require: rubocop-rspec
AllCops:
  TargetRubyVersion: 1.9
  Include:
    - ./**/*.rb
  Exclude:
    - vendor/**/*
    - .vendor/**/*
    - pkg/**/*
    - spec/fixtures/**/*
# We don't use rspec in this way
RSpec/DescribeClass:
  Enabled: False
RSpec/ImplicitExpect:
  Enabled: False
# Example length is not necessarily an indicator of code quality
RSpec/ExampleLength:
  Enabled: False
RSpec/NamedSubject:
  Enabled: False

Where to go next

Fronted-Performance optimieren in Chrome – Like a Boss

Nicht nur Frontend Entwickler kennen es: Man freut sich, dass die hollywoodreifen Animationen auf der Webseite oder im User Interface endlich funktionieren. Ein raffinierter Parallax-Effekt verleiht dem Ganzen dann noch den letzten Schliff. Das Problem: Es ruckelt und hakt an allen Enden, die Lüfter seines nagelneuen Rechners fangen an zu drehen. Was tun?
Zum Glück bieten die Chrome-Developer Tools einige hilfreiche Werkzeuge an, um die Performancefresser zu identifizieren. Diese geben nicht nur einen guten Überblick über Performance-Engpässe sondern dokumentieren außerdem die Bildwiederholrate, CPU-Auslastung und das Asset-Handling.

Wo finde ich diese Tools nun?

Wer die Chrome Developer-Tools kennt, ist möglicherweise schon mal über das Timeline Tab gestolpert. Öffnet man die Ansicht das erste Mal, ist es nicht ganz unwahrscheinlich, dass man von der hohen Informationsdichte erschlagen ist. Daher soll dieser Artikel als eine Art Entry-Point für den Einstieg sein. Denn es lohnt sich.
Ist das Timeline-Tab bereits geöffnet und die Seite wird neu geladen, werden die Performance-Daten des initialen Seitenaufrufes bis zum fertigen Rendern der Seite automatisch aufgezeichnet.
Danach kann man einzelne Aufzeichnungen starten, um z.B. die Performance einzelner Interaktionen auf der Seite untersuchen zu können. Dabei sollte beachtet werden: Je kürzer die Aufnahme und je weniger Aktionen aufgezeichnet werden, desto einfacher ist die Analyse.

Überblick

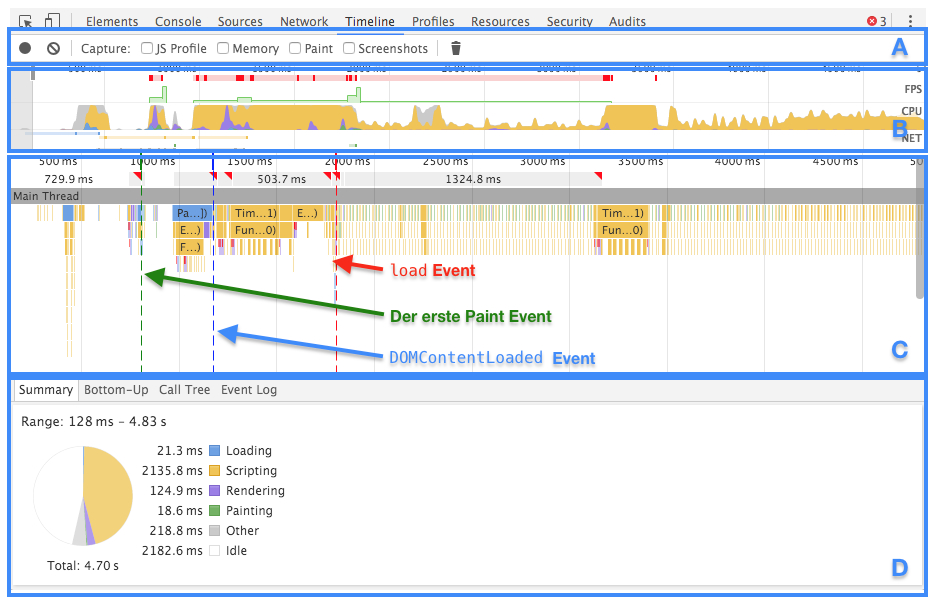
Der Einstieg: Ein kurzer Überblick über die Oberfläche.
Bildschirmfoto 2016-03-30 um 13.07.21

A) Bedienelemente

Die beiden linken Symbole dienen zum Starten und Stoppen der Aufzeichnung. Alternativ kann hierfür das Tastenkürzel cmd + E / Strg + E verwendet werden. Mit den Checkboxen können zusätzliche Informationen an/abgewählt werden, die dann entsprechend mit aufgezeichnet werden.

B) Überblick

Diese Ansicht bietet eine Übersicht über den Verlauf der Seiten-Performance. Sie dient außerdem als Navigation, um den aktuellen Bereich auszuwählen.

C) Flame-Chart

Hier werden die einzelnen Ereignisse und deren Dauer als horizontale Balken visualisiert. Parallele Ereignisse werden nach unten gestapelt. Der findige Beobachter erkennt hier drei unterschiedliche gefärbte vertikale gestrichelte Linien: die blaue Line stellt den DOMContentLoaded-Event dar. Die grüne Linie markiert den ersten Paint-Event und die rote den load Event.

D) Details

Ist kein Ereignis angewählt werden hier die Statistiken für  Zeitraum aufgeführt, der in der Übersichtsansicht ausgewählt ist. Um die Anzeige auf ein Ereignis zu begrenzen, kann im Flame-Chart ein Ereignis ausgewählt werden.
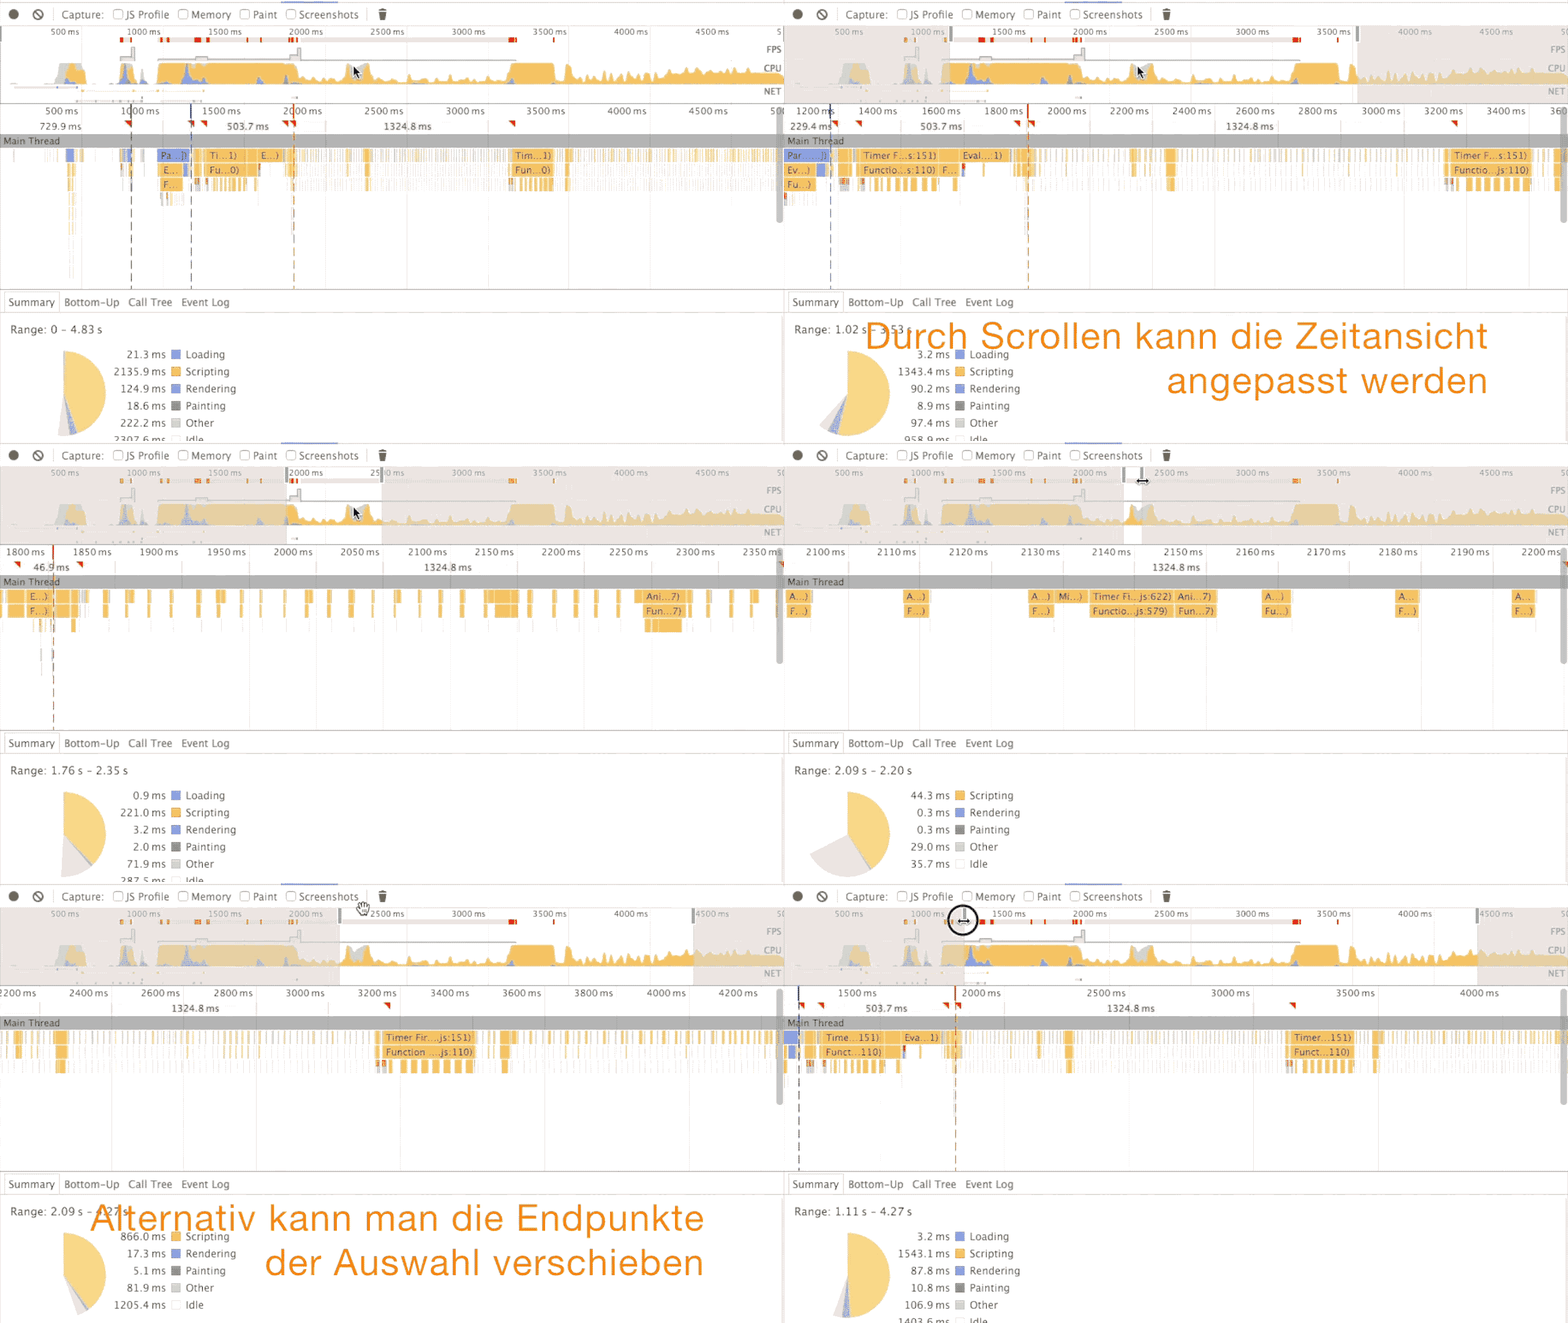
In der Überblicksansicht kann man die Auswahl der Ereignisse eingrenzen in dem man die Regler verschiebt. Die Visualisierungen im Flame-Chart und dem Detailbereich passen sich entsprechend an und beziehen sich nur auf den ausgewählten Bereich.
2016-03-30 16_25_29

Exkurs: Die typische Rendering-Pipeline

In der Regel gibt es fünf verschiedene Schritte bei der Frame-Berechnung, die bei der Entwicklung zu beachten sind. Über diese Bereiche hat  der Entwickler die größte Kontrolle.

Javascript

Typischerweise werden Scriptaufrufe verwendet um Werte zu ändern, die dann in Änderungen der Darstellung resultieren. Das kann z.B. die animate Funktion in jQuery sein oder das Hinzufügen von DOM-Elementen. Diese Darstellungsänderungen werden nicht ausschließlich durch Javascript ausgelöst. Es können auch CSS-Animationen, Transistions, o.ä. dafür verantwortlich sein.

Style Calculations

In diesem Prozess findet der Browser heraus, welche CSS-Regeln anhand der Style-Angaben für welche Elemente angewandt werden müssen.

Layout

Darauf folgt in der üblicherweise die Berechnung der Positionen der jeweiligen Elemente und wie viel Platz diese benötigen. Das Layout-Modell des Webs ist so konzipiert, dass gewisse Abhängigkeiten der Elemente untereinander herrschen. Verändert ein Element, welches mit float positioniert ist seine Breite, beeinflusst es die Position und Größe der umliegenden Elemente.

Paint

Im Painting-Prozess werden die Pixel der einzelnen Elemente berechnet. Es berücksichtigt Eigenschaften wie Text, Farben, Bilder, Rahmen. Die Berechnung findet auf verschiedenen Ebenen (Layers) statt.

Composite

Nachdem Painting-Prozess sind die einzelnen Komponenten (Layers) der Seite bereits berechnet. Beim Compositing werden diese Komponenten dann übereinander gelegt. Besonders entscheidend ist dies bei überlappenden Elementen.

1. JS/CSS >Style > Layout > Paint > Composite

Pasted Graphic
Wenn eine Eigenschaft eines Elements verändert wird, welche dessen Abmessungen oder Position verändert (z.B. height, width, top, left, o.ä, muss der Browser alle oder zumindest alle umliegenden Elemente neu berechnen und zusammengesetzt werden (Layout > Paint > Composite)

2. JS/CSS > Style > Paint > Composite

Pasted Graphic 1

Werden nur Paint-only Eigenschaften geändert (background-image, color, box-shadow), kann der Browser den Layout-Prozess überspringen.

3. JS/CSS > Style > Composite

Pasted Graphic 2

Wenn eine Eigenschaft verändert wird, bei denen der Layout und Painting-Prozess übersprungen werden kann, überspringt der Browser diese Schritte und springt direkt in den Compositiing-Prozess. Darunter fallen z.B. transform oder opacity.
Vor allem für performance-kritische Fälle, z.B. für Animationen oder bei Scroll-Events, bei denen die entsprechenden Funktionen in der Regel besonders oft aufgerufen werden, ist diese Variante besonders erstrebenswert.

Repaintbereiche auf der Seite visualisieren

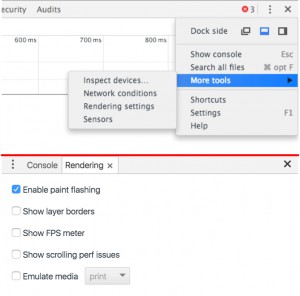
Im DevTools Hauptmenü gibt es einen Eintrag mit der Bezeichnung More Tools nennt. Wählt man hier die Rendering Settings aus, erhält man weitere Funktionen. Ist die zusätzliche Leiste am unteren Bildschirmrand nicht sichtbar, kann man diese mit der Esc-Taste wieder erscheinen lassen.
Im Teilfenster am unteren Bildschirmrand befindet sich dann eine Check-Box mit dem Titel Enable paint flashing.

rendering-settings

Über das DevTools Hauptmenü können weitere Tools eingeblendet werden.


Aktiviert man diese werden auf der Seite Bereiche markiert, bei denen Painting-Events auftreten. So erhält man in Echtzeit einen guten Überblick, welche Bereiche für mögliche Performance-Engpässe sorgen.
2016-03-30 22_26_11
————
Es gibt einen Talk von Paul Irish, der mehrere Anwendungsbeispiele veranschaulicht.

Florian Strohmaier
Florian Strohmaier
Senior UX Designer

Mit seinen Spezialgebieten UI-Konzeption, Prototyping und Frontendentwicklung unterstützt Florian das Dev-Team bei NETWAYS. Trotz seines Design-Backgrounds fühlt er sich auch in der Technik zuhause. Gerade die Kombination aus beidem hat für ihn einen besonderen Reiz.

Working with git subtree

In case your are organising multiple git repositories and add them into one global, the most obvious choice is to use git submodule. It basically creates a pointer to a specific git commit hash in a remote repository allowing you to clone the repository into a sub directory as module.
Adding submodules is fairly easy, purging them can become cumbersome. When we were working on the Icinga Vagrant boxes one issue was to re-organize the used puppet modules into a central modules directory, as well as purge all local copies and instead use the official git repositories others provided.
Using git submodules turned out to be simple to add, but ugly to manage. Users normally forgot to initialise and update the submodules, and if the developers (me) decided to add/remove modules, it was always in sort of an incompatible check-out state. A fresh git clone –recursive always helped (hi Bernd) but in the end it wasn’t satisfying to work with as users struggled from a simple demo setup with Vagrant.
Looking for alternatives unveiled git subtree as originally suggested by Eric – instead of only adding a module and its commit pointer, you’ll add the repository and all of its commit history into your own git repository, as sub tree with directories and files. This also solves the problem that remote repositories might be gone, unreachable, or anything else hindering the successful clone.
There are several options like to squash the history into a single commit (like one would use git rebase) when adding a new subtree.
 

Add a subtree

When I was working on the Graphite/Grafana integration into the icinga2x box, I’ve just added the Grafana puppet module. The –prefix parameter defines the root directory for the cloned repository, then add the remote url, the branch and let it squash the entire commit history (–squash).
Git doesn’t like uncommitted changes so make sure to stash/commit any existing changes before adding a new subtree.

git subtree add --prefix modules/grafana https://github.com/bfraser/puppet-grafana.git master --squash

This results into two new commits:

commit 0b3e0c215e3021696fce3a37eff3274c174348a8
Merge: 482dc29 6d6fd37
Author: Michael Friedrich <michael.friedrich@netways.de>
Date:   Sat Nov 14 18:47:39 2015 +0100
    Merge commit '6d6fd37ec971314d820c210a50587b9d4ca2124b' as 'modules/grafana'
commit 6d6fd37ec971314d820c210a50587b9d4ca2124b
Author: Michael Friedrich <michael.friedrich@netways.de>
Date:   Sat Nov 14 18:47:39 2015 +0100
    Squashed 'modules/grafana/' content from commit 89fe873
    git-subtree-dir: modules/grafana
    git-subtree-split: 89fe873720a0a4d2d3c4363538b0fa5d71542f41


Update a subtree

In case the remote repository should be updated to incorporate the latest and greatest fixes, you can just use „git subtree pull“. You’ll need the repository url (that is merely why it is documented in README.md inside the Vagrant box project).

$ git subtree pull --prefix modules/grafana https://github.com/bfraser/puppet-grafana.git master --squash
From https://github.com/bfraser/puppet-grafana
 * branch            master     -> FETCH_HEAD
Subtree is already at commit 89fe873720a0a4d2d3c4363538b0fa5d71542f41.


Purge a subtree

Purging a git subtree is also fairly easy – just remove the directory and commit the change. There are no additional config settings to purge unlike known from git submodules.
If you want to get more in-depth insights into Git make sure to check out the new Git training 🙂

Improved NodeJS Events durch Cluster …


… jeder von euch kennt das Problem, der Kollege kommt um die Ecke und möchte wenn möglich sofort, dass ein neues geiles Tools mit in den Infra Stack aufgenommen wird, gesagt getan.
In diesem Bespiel eine besonders cooles in NodeJS geschriebenes Dashboard für… lass es hier ein DockerManagement Tool sein. Dabei stößt man bei der großen Akzeptanz durch die Kollegen, auch auf einmal auf noch ganz andere Probleme (Stichwort: Performance Bottlenecks wie DDoS durch eigene Leute).
Hierbei könnte euch das NodeJS Modul Cluster behilflich sein, hier ist die Doku zu finden.
Cluster macht dabei nicht viel, es erweitert den NodeJS Stack insbesondere das Event Driven Modell von NodeJS ( so Arbeitet Google(s) v8 Engine ) um eine Art Interprocess Schnittstelle zu forked Child NodeJS Prozessen, die sich dabei Filesystem Elemente/Typen wie Sockets, Filedeskriptoren etc. teilen können und somit gemeinsam auf diesen operieren können.
Hier wollen wir eine schon bestehende Express Framework Anwendung mit einigen wenigen Zeilen Code um die Fähigkeit erweitern, dem System zur Verfügung stehenden CPU Cores effizienter ausnutzen zu können, damit sich die Events schneller abarbeiten lassen.
Ich werde hier allerdings nicht Express selber beschreiben, sondern setzte hier voraus das der Leser dieses Framework kennt. Wenn nicht könnt ihr die Infos unter diesem Link abrufen, so let’s beginn …

$ sudo -i                                  # <- da meine Workstation ein Ubuntu ist sollten wir zumindest was die Essentials sind kurz zu 'root' werden um diese Problemlos installiert zu bekommen
$ npm install express -g                   # <- installiert uns das Express Framework samt CLI Tools
express@4.13.3 /usr/lib/node_modules/express
├── escape-html@1.0.2
├── merge-descriptors@1.0.0
├── cookie@0.1.3
├── array-flatten@1.1.1
├── cookie-signature@1.0.6
├── utils-merge@1.0.0
├── content-type@1.0.1
├── fresh@0.3.0
├── path-to-regexp@0.1.7
├── content-disposition@0.5.0
├── vary@1.0.1
├── etag@1.7.0
├── serve-static@1.10.0
├── range-parser@1.0.2
├── methods@1.1.1
├── parseurl@1.3.0
├── depd@1.0.1
├── qs@4.0.0
├── on-finished@2.3.0 (ee-first@1.1.1)
├── finalhandler@0.4.0 (unpipe@1.0.0)
├── debug@2.2.0 (ms@0.7.1)
├── proxy-addr@1.0.8 (forwarded@0.1.0, ipaddr.js@1.0.1)
├── send@0.13.0 (destroy@1.0.3, statuses@1.2.1, ms@0.7.1, mime@1.3.4, http-errors@1.3.1)
├── type-is@1.6.9 (media-typer@0.3.0, mime-types@2.1.7)
└── accepts@1.2.13 (negotiator@0.5.3, mime-types@2.1.7)
$ npm install express-generator -g
/usr/bin/express -> /usr/lib/node_modules/express-generator/bin/express
express-generator@4.13.1 /usr/lib/node_modules/express-generator
├── sorted-object@1.0.0
├── commander@2.7.1 (graceful-readlink@1.0.1)
└── mkdirp@0.5.1 (minimist@0.0.8)
$ exit                                     # <- ab hier geht es ohne 'root' Rechte weiter
$ mkdir cool-app && cd cool-app            # <- Projekt Verzeichnis anlegen und in dieses wechseln
$ pwd                                      # <- vergewissern das wir uns auch in diesem wirklich befinden
/home/enzo/nodejsProjects/cool-app
$ express --git .                          # <- wir provisionieren uns unser Projekt from Scratch, dieses ist somit direkt Lauffähig ohne das wir einen Zeile Code schreiben müssen, haben hier leider keine Zeit zu 😉
   create : .
   create : ./package.json
   create : ./app.js
   create : ./.gitignore
   create : ./public
   create : ./routes
   create : ./routes/index.js
   create : ./routes/users.js
   create : ./views
   create : ./views/index.jade
   create : ./views/layout.jade
   create : ./views/error.jade
   create : ./bin
   create : ./bin/www
   create : ./public/javascripts
   create : ./public/images
   create : ./public/stylesheets
   create : ./public/stylesheets/style.css
   install dependencies:
     $ cd . && npm install
   run the app:
     $ DEBUG=cool-app:* npm start
$

Ab hier können wir das ganze mal kurz testen, um uns zu vergewissern das die Anwendung auch läuft ...

$ npm start
> cool-app@0.0.0 start /home/enzo/nodejsProjects/cool-app
> node ./bin/www

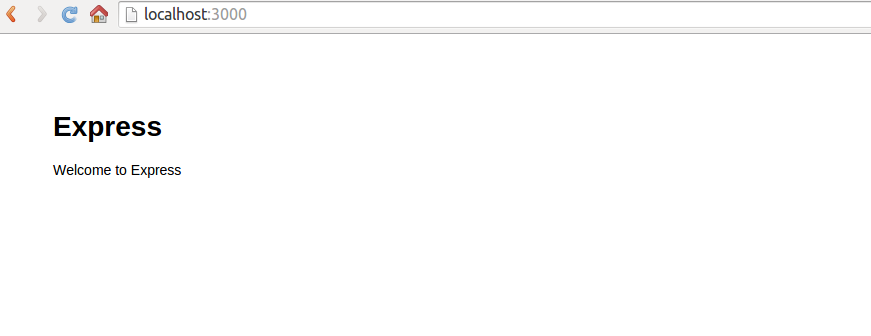
Nicht wundern die Applikation bleibt im Vordergrund hängen, was ist Ok ist, somit können wir diese schneller terminieren und relaunchen. Weiter geht es mit einem Test im Browser, die Anwendung lauscht standardmäßig am Port 3000, somit rufen wir hier einmal http://localhost:3000 auf und lassen uns überraschen was da so schönes kommt ...

Geil es läuft also, nun gut machen wir das ganze mit Cluster noch skalierbarer, let's go ...
Öffnet hierzu im Projekt Verzeichnis einmal die bin/www Datei, diese stellt laut package.json unseren Eintrittspunkt in die Anwendung dar, wir kopieren uns diese als Backup weg bevor wir anfangen hier Änderungen vorzunehmen.
Kommentiert bitte folgende Zeilen einmal aus ...

/**
 * Get port from environment and store in Express.
 */
var port = normalizePort(process.env.PORT || '3000');
app.set('port', port);
/**
 * Create HTTP server.
 */
var server = http.createServer(app);
/**
 * Listen on provided port, on all network interfaces.
 */
server.listen(port);
server.on('error', onError);
server.on('listening', onListening);

... nun fügt ihr ab Zeile 10 bitte folgendes hinzu ...

// cluster requirements
var cluster = require('cluster');
var numCPUs = require('os').cpus().length;
if( cluster.isMaster ) {
  for( var i = 0; i < numCPUs; i++ ) {
    cluster.fork();
  }
  cluster.on( 'listening', function( worker ){
    console.log( 'worker ' + worker.process.pid + ' is now listen for incoming connections ... ' );
  });
  cluster.on( 'exit', function( worker, code, signal ) {
    console.log( 'worker ' + worker.process.pid + ' died' );
  });
} else {
    // Workers can share any TCP connection
    // In this case it is an HTTP server
    /**
    * Get port from environment and store in Express.
    */
    var port = normalizePort(process.env.PORT || '3000');
    app.set('port', port);
    /**
    * Create HTTP server.
    */
    var server = http.createServer(app);
    /**
    * Listen on provided port, on all network interfaces.
    */
    server.listen(port);
    server.on('error', onError);
    server.on('listening', onListening);
}

.. jetzt sollte das ganze auch schon funktionieren, probieren wir es doch einmal aus.

$ npm start
> cool-app@0.0.0 start /home/enzo/nodejsProjects/cool-app
> node ./bin/www
worker 31979 is now listen for incoming connections ...
worker 31974 is now listen for incoming connections ...
worker 31985 is now listen for incoming connections ...
worker 31996 is now listen for incoming connections ...
GET / 304 840.784 ms - -
GET /stylesheets/style.css 304 31.416 ms - -

Jetzt könnte man denken das sich hier nichts geändert hat, dem ist aber nicht so, der Beweis ist in der Prozess Tabelle zu finden, gucken wir doch kurz einmal hinein ...

$ ps auxf | grep node
enzo     31969  0.1  0.4 901264 33004 pts/7    Sl+  14:47   0:00          |   |       \_ node ./bin/www
enzo     31974  0.1  0.4 901256 32324 pts/7    Sl+  14:47   0:00          |   |           \_ /usr/bin/nodejs /home/enzo/nodejsProjects/cool-app/bin/www
enzo     31979  0.4  0.6 946192 47560 pts/7    Sl+  14:47   0:01          |   |           \_ /usr/bin/nodejs /home/enzo/nodejsProjects/cool-app/bin/www
enzo     31985  0.1  0.4 902668 32736 pts/7    Sl+  14:47   0:00          |   |           \_ /usr/bin/nodejs /home/enzo/nodejsProjects/cool-app/bin/www
enzo     31996  0.1  0.4 901256 32168 pts/7    Sl+  14:47   0:00          |   |           \_ /usr/bin/nodejs /home/enzo/nodejsProjects/cool-app/bin/www

Whoop whoop, 4 neue NodeJS Prozesse die hier ihre Arbeit verrichten, somit lassen sich auch die beschäftigsten Web Anwendungen wieder beschleunigen.
Das ist aber nur der Anfang wie sich NodeJS Applications aller Art verbessern lassen, für weiter Themen habe ich heute allerdings keine Zeit daher heben wir uns den Rest einfach für ein anderes mal auf.
Ich wünsche euch hiermit noch viel Spaß, ich hoffe ihr habt nun mehr Lust auf NodeJS bekommen.

From Perl to Python and beyond

I’ve seen and learned plenty of programming languages either during my studies or in work or spare time related projects – be it C/C++/C#, VHDL, Java or PHP/Perl/Python/Ruby even (I’ve removed some in my XING profile to reduce recruiter spam level ;)). Choosing the „right“ language is always hard but most of the time the requirements of existing software or newly designed projects allow you to skip that part and already have one in mind.
python-logo-master-v3-TMWhen joining NETWAYS in late 2012, I took over the LConf backend project being entirely written in Perl similar to other plugins and scripts floating around as open source software. Icinga 1.x Core is partially using Perl as well (although embedded Perl in C is a horrible mess). Most recently our development team decided to go for Python as the primary programming language.
So, my Python foo wasn’t that good after some years not really using it. Learning from my colleagues and looking into additional ressources helped a lot. I also found „Head first Python“ from O’Reilly in my bookshelf as a gift from the Nagios/Icinga cookbook review which also provides an extensive introduction into Python – when you already know a scripting language like Perl.
We’ve been working on a customer’s project developing a plugin framework for executing checks via a defined transport (e.g. ssh) and parsing cli output. Find some collected hints and tricks I’ve learned below.

Remove colors from shell output

The EMC „isi“ cli command puts colors into the shell output (e.g. for a critical state turning the background red). While one could disable color support on the shell, this was not possible in that environment. The fix by Gunnar was easy: Parsing text output into a list called „lines“ and clean the line string from shell color codes:

lines = text.split('\n')
lines = [re.sub('\x1b\[[0-9;]*m', '', line).strip() for line in lines]

Convert datetime to unix timestamp

Consider having a datetime string whose output format is not fixed, which means some strftime print magic does not work for proper parsing. Luckily there’s a Python module called dateutil providing the required functionality.

import time
import datetime
import dateutil.parser
def datetime2unixts(time_str):
    dt = dateutil.parser.parse(time_str)
    return time.mktime(dt.timetuple())
$ python
Python 2.7.8 (default, Apr 15 2015, 09:26:43)
[GCC 4.9.2 20150212 (Red Hat 4.9.2-6)] on linux2
Type "help", "copyright", "credits" or "license" for more information.
>>> import time, datetime, dateutil.parser
>>> def datetime2unixts(time_str):
...     dt = dateutil.parser.parse(time_str)
...     return time.mktime(dt.timetuple())
...
>>> time_str = "Wed May 13 16:15:34 CEST 2015"
>>> datetime2unixts(time_str)
1431526534.0

Initialize nested dictionary

Similar to what I am used to do with Perl and hashes I was stumbling over this with Python. In Perl one does not care about initializers, but just keeps populating all items like so:

my $hash = {}
$hash{'key1'}{'key2'} = "val1";

In Python this does not work out-of-the-box. There are some modules available such as „collectors“, but I prefer a somewhat native implementation making it work on older distributions. I came across this solution which I consider pure awesome 🙂

class AutoVivification(dict):
    """Implementation of perl's autovivification feature."""
    def __getitem__(self, item):
        try:
            return dict.__getitem__(self, item)
        except KeyError:
            value = self[item] = type(self)()
            return value
hash = AutoVivification()
hash["key1"]["key2"] = "val1"

Note: It certainly does create non-existing keys if you are checking for their existance. My implementation does not care about key checks, but requires known-to-exist values from a flat dictionary with „id_label“ as key stashed into a nested dictionary where id and label are separated/nested for further operations.

        jobs = AutoVivification()  # use a pre-initialized nested dict
        for k, v in sorted(perfdata.iteritems()):
            (job_id, label) = k.split("_", 1)
            if label == "ended_ts":
                jobs[job_id][label] = float(v)
            if label == "started_ts":
                jobs[job_id][label] = float(v)

Fix the indent

If your editor doesn’t do that automatically (e.g. converting tabs into 4 spaces) it might still work, but could also cause weird behaviour in Python depending on the indent only (no brackets as I am used to with Perl). Fixing this is fairly easy by using autopep8 – I’m using Fedora 22:

dnf install python-autopep8
autopep8 check_plugin -i

Note: ‚-i‘ replaces the given file with all the changes. Make sure to commit your other changes to git before.

Conclusion

I never thought that I would dig deep in Python again that easy. I used to hack that in the past with Win2k usb driver test frameworks, and also checkmk plugins, but gaining back experience worked out pretty well.
Icinga 2’s code, value types and configuration look a lot like Python as well – take dictionaries for custom attributes using apply for loops, eh? (Hint: Testdrive this config snippet inside the Icinga 2 Docker container).

object Host "dns" {
  import "generic-host"
  address = "127.0.0.1"
  address6 = "::1"
  vars.dns_checks["dns icinga.org"] = {
    dns_lookup = "icinga.org"
    dns_server = "ns1.netways.de"
    dns_expected_answers = "185.11.254.83"
  }
  vars.dns_checks["dns netways.org"] = {
    dns_lookup = "netways.org"
    dns_server = "ns1.netways.de"
    dns_expected_answers = "185.11.252.37"
  }
}
apply Service for (dns_check => config in host.vars.dns_checks) {
  check_interval = 1m
  retry_interval = 30s
  check_command = "dns"
  vars += config
}

Icinga 2, plugins, your project – here I come 🙂
PS: See you at the OSMC hackathon.