Seite wählen

NETWAYS Blog

Google-Analytics in Prestashop richtig verwenden

Seit nun fast 4 Monaten betreiben wir unseren Online-Shop nicht mehr mit Magento, sondern mit PrestaShop. Dies bringt bereits ein Google-Analytics Plugin mit. Man gibt nur die Web-Property-ID ein und los geht’s.
Nachdem wir die Daten nun auswerten wollten, sind uns zwar die Nutzerzahlen zu den Vormonaten plausibel erschienen, jedoch waren alle Aufrufe in die Systemeigenen URLs gepackt.
So waren alle Produktaufrufe in /product und alle Kategorieklicks in /category gebündelt eingeordnet. Dies nützt ein natürlich wenig, wenn man genau sehen will, welches Produkt sich gut verkauft und welches nicht.
before
Mit wenigen Änderungen am Sourcecode des Google-Analytics Moduls behebt man jedoch diesen „Fehler“:

  • auf den Shopserver verbinden
  • in das Verzeichnis von PrestaShop wechseln
  • in das Verzeichnis modules/ganalytics/ wechseln
  • die Datei ganalytics.php vorher sichern
  • ganalytics.php mit einem Editor der Wahl öffnen
  • folgenden Abschnitt suchen
$file = str_replace(array('.php', '-'), '', basename($_SERVER['SCRIPT_NAME']));
  • um folgenden Code ergänzen
if($file == "category" ||
$file == "product" ||
$file == "search" ||
$file == "cms" ||
$file == "index") {
$file = $_SERVER["REQUEST_URI"];
}
  • noch einmal kontrollieren
$file = str_replace(array('.php', '-'), '', basename($_SERVER['SCRIPT_NAME'])); 
if($file == "category" ||
$file == "product" ||
$file == "search" ||
$file == "cms" ||
$file == "index") {
$file = $_SERVER["REQUEST_URI"];
}
  • speichern
  • fertig

after
Schon am nächsten Tag sammelt Google-Analytics die richtigen URLs ein.

Schnelle Datenabfrage für Nagios und Icinga

Mit der Version 1.1.0 des check_mk Plugins zur Serverüberwachung ist auch das AddOn LiveStatus stable geworden. Dieses Tool bietet eine sehr effiziente Möglichkeit aktuelle Statusdaten direkt aus dem Nagios Kern abzufragen und anderen Anwendungen, wie beispielsweise NagVis (Support seit V1.4.5) zur Verfügung zu stellen.
Durch die Beschränkung auf die im Nagios oder Icinga Core vorhandenen Daten, kann das Tool leider keine historischen Daten liefern, punktet dafür aber mit einem gehörigen Geschwindigkeitsvorteil. Diesen Nachteil hat es mit der anderen, ebenfalls performanten Alternative ndo2fs gemein. Dafür fällt die Notwendigkeit einer Datenbank und man spart sich damit den Zusatzaufwand.
Leider fehlt die generische API um auf alle möglichen Datenquellen zuzugreifen, aber die Icinga API soll neben der MySQL, Oracle, PostgreSQL Fähigkeit auch für LiveStatus angepasst werden. Um aber nicht für alle AddOns den Support für jedes Backend implementieren zu müssen, ist die API auf jeden Fall ein Schritt in die richtige Richtung. Der größte Teil der Arbeit dafür ist auch schon getan und via GIT verfügbar.
Übrigens kann man LiveStatus natürlich nicht nur als Nagios Event Broker Module betreiben sondern auch mit Icinga.

Weekly snap: Install, review and release – NConf, Workbench and Heatmap

Weekly snap
June 29 – July 3 saw the release of MySQL Workbench 5.1 with a few honest thoughts from Bernd E on the former DBDesigner. After testing the community version, he discovered that Reverse Engineering is also available there just as in the standard version, contrary to the official website’s feature list. All in all Bernd gave us the thumbs up – if only for the colour coded foreign key relationships in the ER Modeller. To add to this, Bernd posted his Linux Day presentation slides on ‘XEN in high availability environments’ with praxis oriented solutions, free for all.
Julian showed us how to install NConf on Debian Lenny in 6 easy steps while hardware guru Martin K introduced the Mess PC alternative to email and SMS monitoring notifications – Switch Module 230V 16A won’t go unnoticed with acoustic and visual alerts for those noisy workplaces.
Just in case one new release is not enough, William proudly presented the Generate-a-Heatmap-with-data-from-the-NDO-Database Addon for Nagios / Icinga, aptly dubbed NETWAYS Heatmap for all to download.

NConf 1.2.5 released

nconfLast week, the creators of NConf, a new Nagios configuration tool, released a new version. Tobias Redel and I wrote an article for the last issue of Linux Magazin. We were both very impressed, because the tool is the first config tool that works in environments with multiple Nagios servers. It can create active configuration for the polling server and also create a passive config for the central Nagios server, recieving all of its checkresults passive via NSCA.
Another problem of webbased configtools is speed. Normaly it takes significantly longer to configure hundreds of hosts via web than with vi or other editors. NConf helps speeding up configuration times by providing time saving tools like host cloning or bulk updates of multiple hosts or services.
Version 1.2.5 now added the folowing features:

  • clone services between different hosts
  • a graphical treeview of host dependencies
  • an editor for static configuration files
  • an importer of existing Nagios configuration files
  • a database API

Even with the last two features being still in beta, we think NConf is heading into the right direction. The importer will make it much easier to integrate NConf into existing Nagios environments. The tool can be downloaded at http://nconf.sourceforge.net/

Julian Hein
Julian Hein
Executive Chairman

Julian ist Gründer und Eigentümer der NETWAYS Gruppe und kümmert sich um die strategische Ausrichtung des Unternehmens. Neben seinem technischen und betriebswirtschaftlichen Background ist Julian häufig auch kreativer Kopf und Namensgeber, beispielsweise auch für Icinga. Darüber hinaus ist er als CPO (Chief Plugin Officer) auch für die konzernweite Pluginstrategie verantwortlich und stösst regelmässig auf technische Herausforderungen, die sonst noch kein Mensch zuvor gesehen hat.

Ask the developer: NagiosGrapher


What is NagiosGrapher?
NagiosGrapher is a Nagios add on which automatically generates performance charts and graphs from returned Nagios values. It takes the raw Nagios data and turns it into normalised values administrators can analyse, either on its own or Nagios’ web interface.
NagiosGrapher and NETWAYSGrapherV2 – what’s the difference?
They use a completely different architecture. NagiosGrapher is the predecessor to NETWAYSGrapherV2, but as it is so popular in the community, we decided to keep the project running. We’ve invested the latest technologies in the NETWAYSGrapherV2 however, and that is our main ‘grapher’ project.
How does it work?
Nagios plugins run checks on hosts and services, returning results in strings of extended information. The NagiosGrapher daemon receives these via perf-files or a pipe, filters them of numeric data by using regular expressions  and stores the data in a RRD (Round Robin Database). The functions we built use the RRD to create graphs from the data values and are generated on request – in real-time (or within 5 min). All interaction can be made on a Perl CGI based front end, or through the Nagios system itself.
Any interesting features?multigraphs
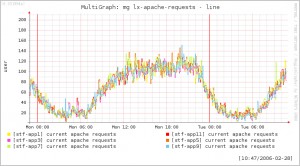
Aside from the real-time graphing as mentioned above, NagiosGrapher also does ‘Mulit-graphs’. Several different graphs can be brought together and displayed in one view, which is quite handy when analysing multiple switch ports for example.
NagiosGrapher also features a ‘process-service-perfdata’ interface, so no patches or changes to the Nagios system needs to be made. This ensures that it is easy to install and maintain. Unlike some other programs, you don’t need to repeat installations because it automatically recognises new devices and services, incorporating their monitoring values for graphing. And because it runs on RRD with automated data cleanup, the database stays at a fixed size, keeping the backend slim.

What is the ‘process-service-perfdata’ interface exactly?

This is an extra specialised interface between Nagios and the RRD where the returned Nagios performance values are normalised. Because it acts as a kind of translation device, no patches or alterations need to be made to Nagios itself, making installation and operation much smoother.
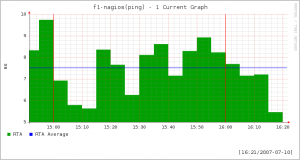
f1-nagios_ping_1currentHow does it compare to other graphing tools?
NagiosGrapher is one of the most popular, longstanding graphing tools for Nagios, alongside nagiosgraph and PnP. Where PnP is easier and faster to configure, it only reads perfdata. NagiosGrapher is more complex but can check older plugin output, and breaks into components easily, thus being also more flexible. This makes it fantastic to scale and implement in large environments.
Any plans for further developments?
NagiosGrapher has been around for quite a while now, but at least it’s reliably stable and very robust. Basically, we’ll keep with maintenance and patches but really our main development work is on the NETWAYSGrapherV2 – speaking of which, we have just released the RC1.
NagiosGrapher in a nutshell?
The old-timer basic Grapher for reliable performance charts, easy to install, easy to maintain and good for large environments – but not as dynamic as the new NETWAYSGrapherV2!
More information:
Join the project or download