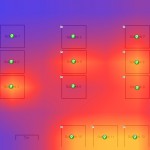
So you’ve covered the Data Centre in temperature sensors, and added them into your Nagios / Icinga monitor. You’ve configured the monitoring server to send alerts when things get too hot and everything works perfectly. You proudly explain how it all functions to anyone who will listen.
Unfortunately your colleagues aren’t impressed… What you need is some pretty graphics!
WE PROUDLY PRESENT
The Generate-a-Heatmap-with-data-from-the-NDO-Database Addon for Nagios / Icinga, otherwise known as heatmap.
It’s a pretty little drag-n-drop AJAXy thing that certainly won’t replace a proper Data Centre CFD Model, but it looks realistic enough to show your co-workers.
Parts of the first version were sponsored by Wilken-Group.
Have fun


0 Kommentare