Seite wählen

NETWAYS Blog

Secure Elasticsearch and Kibana with an Nginx HTTP Proxy

Elasticsearch provides a great HTTP API where applications can write to and read from in high performance environments. One of our customers sponsored a feature for Icinga 2 which writes events and performance data metrics to Elasticsearch. This will hit v2.8 later this year.
We’re also concerned about security, and have been looking into security mechanisms such as basic auth or TLS. Unfortunately this isn’t included in the Open Source stack.
 

Why should you care about securing Elasticsearch and Kibana?

Modern infrastructure deployments commonly require Elasticsearch listening on an external interface and answering HTTP requests. Earlier this year we’ve learned about ransomware attacks on MongoDB and Elasticsearch too.
During development I’ve found this API call – just clear everything inside the database.

[root@icinga2-elastic ~]# curl -X DELETE http://localhost:9200/_all
{"acknowledged":true}

I don’t want any user to run this command from anywhere. You can disable this by setting „action.destructive_requires_name“ to „true“ inside the configuration, but it is not the default.
A similar thing is that you can read and write anything without any access rules in place, no matter if querying Elasticsearch or Kibana directly.
 

Firewall and Network Segments

A possible solution is to limit the network transport to only allowed hosts via firewall rules and so on. If your Elasticsearch cluster is running on a dedicated VLAN, you would need to allow the Icinga 2 monitoring host to write data into – anyone on that machine could still read/write without any security mechanism in place.
 

HTTP Proxy with Nginx

Start with the plain proxy pass configuration and forward http://localhosT:9200 to your external interface (192.168.33.7 in this example).

# MANAGED BY PUPPET
server {
  listen       192.168.33.7:9200;
  server_name  elasticsearch.vagrant-demo.icinga.com;
  index  index.html index.htm index.php;
  access_log            /var/log/nginx/ssl-elasticsearch.vagrant-demo.icinga.com.access.log combined;
  error_log             /var/log/nginx/ssl-elasticsearch.vagrant-demo.icinga.com.error.log;
  location / {
    proxy_pass            http://localhost:9200;
    proxy_read_timeout    90;
    proxy_connect_timeout 90;
    proxy_set_header      Host $host;
    proxy_set_header      X-Real-IP $remote_addr;
    proxy_set_header      X-Forwarded-For $proxy_add_x_forwarded_for;
    proxy_set_header      Proxy "";
  }
}

Restart Nginx and test the connection from the external interface.

# systemctl restart nginx
# curl -v http://192.168.33.7:9200

Once this is working, proceed with adding basic auth and TLS.
 

HTTP Proxy with Basic Auth

This leverages the access level to authenticated users only. Best is to manage the basic auth users file with Puppet, Ansible, etc. – similar to how you manage your Nginx configuration. Our consultants use that method on a regular basis, and provided me with some examples for Nginx. You could do the same for Apache – I would guess that is a matter of taste and performance here.
Generate a username/password combination e.g. using the htpasswd CLI command.

htpasswd -c /etc/nginx/elasticsearch.passwd icinga

Specify the basic auth message and the file which contains the basic auth users.

    auth_basic                "Elasticsearch auth";
    auth_basic_user_file      "/etc/nginx/elasticsearch.passwd";

Restart Nginx and connect to the external interface.

# systemctl restart nginx
# curl -v -u icinga:icinga http://192.168.33.7:9200


HTTP Proxy with TLS

The Elasticsearch HTTP API does not support TLS out-of-the-box. You need to enforce HTTPS via HTTP Proxy, enable ssl and set up the required certificates.
Enforce the listen address to SSL only. That way http won’t work.

  listen       192.168.33.7:9200 ssl;

Enable SSL, specify the certificate paths on disk, use TLSv1 and above and optionally secure the used ciphers.

  ssl on;
  ssl_certificate           /etc/nginx/certs/icinga2-elastic.crt;
  ssl_certificate_key       /etc/nginx/certs/icinga2-elastic.key;
  ssl_session_cache         shared:SSL:10m;
  ssl_session_timeout       5m;
  ssl_protocols             TLSv1 TLSv1.1 TLSv1.2;
  ssl_ciphers               ECDHE-ECDSA-CHACHA20-POLY1305:ECDHE-RSA-CHACHA20-POLY1305:ECDHE-ECDSA-AES128-GCM-SHA256:ECDHE-RSA-AES128-GCM-SHA256:ECDHE-ECDSA-AES256-GCM-SHA384:ECDHE-RSA-AES256-GCM-SHA384:DHE-RSA-AES128-GCM-SHA256:DHE-RSA-AES256-GCM-SHA384:ECDHE-ECDSA-AES128-SHA256:ECDHE-RSA-AES128-SHA256:ECDHE-ECDSA-AES128-SHA:ECDHE-RSA-AES256-SHA384:ECDHE-RSA-AES128-SHA:ECDHE-ECDSA-AES256-SHA384:ECDHE-ECDSA-AES256-SHA:ECDHE-RSA-AES256-SHA:DHE-RSA-AES128-SHA256:DHE-RSA-AES128-SHA:DHE-RSA-AES256-SHA256:DHE-RSA-AES256-SHA:ECDHE-ECDSA-DES-CBC3-SHA:ECDHE-RSA-DES-CBC3-SHA:EDH-RSA-DES-CBC3-SHA:AES128-GCM-SHA256:AES256-GCM-SHA384:AES128-SHA256:AES256-SHA256:AES128-SHA:AES256-SHA:DES-CBC3-SHA:!DSS;
  ssl_prefer_server_ciphers on;
  ssl_trusted_certificate   /etc/nginx/certs/ca.crt;

Restart Nginx and connect to the external interface on https. Note: Host verification is disabled in this example.

# systemctl restart nginx
# curl -v -k -u icinga:icinga https://192.168.33.7:9200


Combine HTTP Proxy, TLS and Basic Auth

A complete configuration example could look like this:

vim /etc/nginx/sites-enabled/elasticsearch.vagrant-demo.icinga.com.conf
# MANAGED BY PUPPET
server {
  listen       192.168.33.7:9200 ssl;
  server_name  elasticsearch.vagrant-demo.icinga.com;
  ssl on;
  ssl_certificate           /etc/nginx/certs/icinga2-elastic.crt;
  ssl_certificate_key       /etc/nginx/certs/icinga2-elastic.key;
  ssl_session_cache         shared:SSL:10m;
  ssl_session_timeout       5m;
  ssl_protocols             TLSv1 TLSv1.1 TLSv1.2;
  ssl_ciphers               ECDHE-ECDSA-CHACHA20-POLY1305:ECDHE-RSA-CHACHA20-POLY1305:ECDHE-ECDSA-AES128-GCM-SHA256:ECDHE-RSA-AES128-GCM-SHA256:ECDHE-ECDSA-AES256-GCM-SHA384:ECDHE-RSA-AES256-GCM-SHA384:DHE-RSA-AES128-GCM-SHA256:DHE-RSA-AES256-GCM-SHA384:ECDHE-ECDSA-AES128-SHA256:ECDHE-RSA-AES128-SHA256:ECDHE-ECDSA-AES128-SHA:ECDHE-RSA-AES256-SHA384:ECDHE-RSA-AES128-SHA:ECDHE-ECDSA-AES256-SHA384:ECDHE-ECDSA-AES256-SHA:ECDHE-RSA-AES256-SHA:DHE-RSA-AES128-SHA256:DHE-RSA-AES128-SHA:DHE-RSA-AES256-SHA256:DHE-RSA-AES256-SHA:ECDHE-ECDSA-DES-CBC3-SHA:ECDHE-RSA-DES-CBC3-SHA:EDH-RSA-DES-CBC3-SHA:AES128-GCM-SHA256:AES256-GCM-SHA384:AES128-SHA256:AES256-SHA256:AES128-SHA:AES256-SHA:DES-CBC3-SHA:!DSS;
  ssl_prefer_server_ciphers on;
  ssl_trusted_certificate   /etc/nginx/certs/ca.crt;
  uth_basic                "Elasticsearch auth";
  auth_basic_user_file      "/etc/nginx/elasticsearch.passwd";
  index  index.html index.htm index.php;
  access_log            /var/log/nginx/ssl-elasticsearch.vagrant-demo.icinga.com.access.log combined;
  error_log             /var/log/nginx/ssl-elasticsearch.vagrant-demo.icinga.com.error.log;
  location / {
    proxy_pass            http://localhost:9200;
    proxy_read_timeout    90;
    proxy_connect_timeout 90;
    proxy_set_header      Host $host;
    proxy_set_header      X-Real-IP $remote_addr;
    proxy_set_header      X-Forwarded-For $proxy_add_x_forwarded_for;
    proxy_set_header      Proxy "";
  }
}

The following example query does not verify the offered host certificate. In case you configure the ElasticWriter feature in Icinga 2 v2.8, you’ll find the options to specify certificates for TLS handshake verification.

$ curl -v -k -u icinga:icinga https://192.168.33.7:9200
* Rebuilt URL to: https://192.168.33.7:9200/
*   Trying 192.168.33.7...
* TCP_NODELAY set
* Connected to 192.168.33.7 (192.168.33.7) port 9200 (#0)
* WARNING: disabling hostname validation also disables SNI.
* TLS 1.2 connection using TLS_ECDHE_RSA_WITH_AES_128_GCM_SHA256
* Server certificate: icinga2-elastic
* Server auth using Basic with user 'icinga'
> GET / HTTP/1.1
> Host: 192.168.33.7:9200
> Authorization: Basic aWNpbmdhOmljaW5nYQ==
> User-Agent: curl/7.54.0
> Accept: */*
>
< HTTP/1.1 200 OK
< Server: nginx/1.12.1
< Date: Tue, 12 Sep 2017 13:52:31 GMT
< Content-Type: application/json; charset=UTF-8
< Content-Length: 340
< Connection: keep-alive
<
{
  "name" : "icinga2-elastic-elastic-es",
  "cluster_name" : "elastic",
  "cluster_uuid" : "axUBwxpFSpeFBmVRD6tTiw",
  "version" : {
    "number" : "5.5.2",
    "build_hash" : "b2f0c09",
    "build_date" : "2017-08-14T12:33:14.154Z",
    "build_snapshot" : false,
    "lucene_version" : "6.6.0"
  },
  "tagline" : "You Know, for Search"
}
* Connection #0 to host 192.168.33.7 left intact


Conclusion

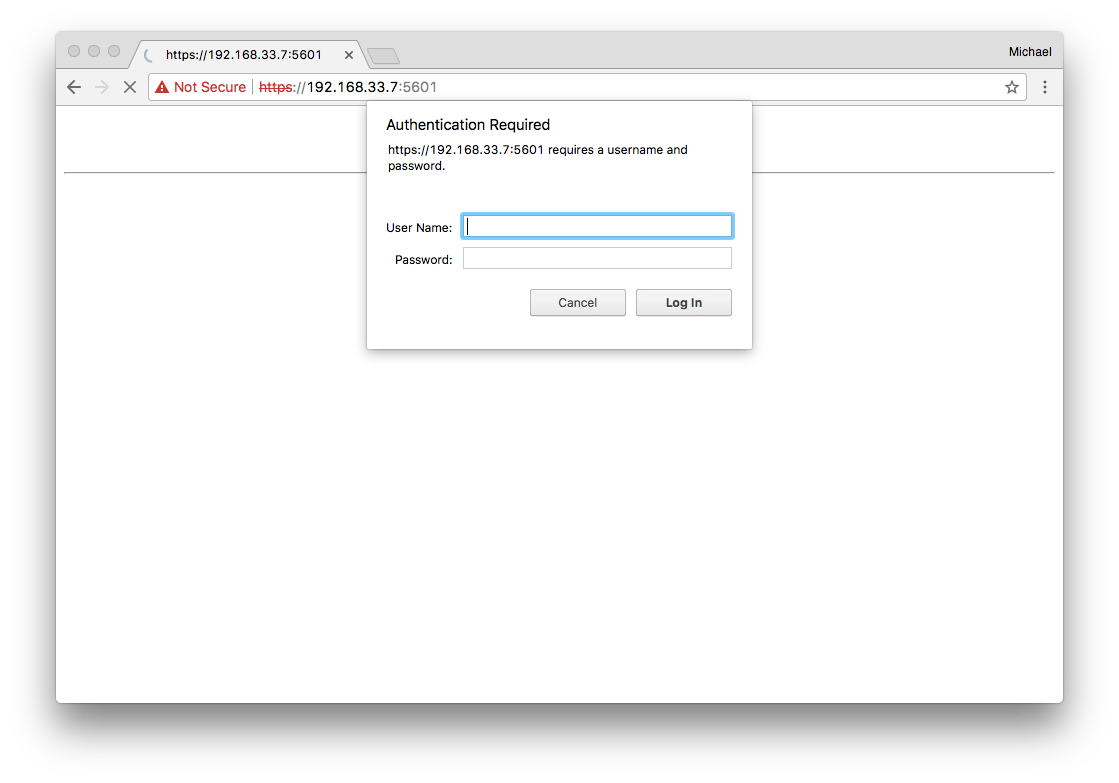
Secure data transfer from your monitoring instances to Elasticsearch is mandatory. Basic access control via basic auth should also be implemented. All of this is possible with the help of a dedicated HTTP Proxy host. Fine granular access control for specific HTTP requests is available in the commercial Shield package or variants. While securing Elasticsearch, also look into Kibana which runs on port 5601.
Since we’ve used the Icinga Vagrant boxes as a development playground, I’ve added Nginx as HTTP Proxy inside the icinga2x-elastic box. This provisions the required basic auth and TLS settings and offers to write data on https://192.168.33.7:9200 (icinga/icinga). The same applies for Kibana. The examples above can be replayed too.
If you want to learn more on this topic, make sure to join our Elastic Stack training sessions or kindly invite one of our consultants for a hands-on workshop. Hint: There is an Elastic Stack workshop at OSMC too 🙂

Request Tracker 4.4 Security Update and UTF8 issues with Perl’s DBD::Mysql 4.042

Last week, Best Practical announced that there are critical security fixes available for Request Tracker. We’ve therefore immediately pulled the patches from 4.4.2rc2 into our test stages and rolled them out in production.

Update == Broken Umlauts

One thing we did notice too late: German umlauts were broken on new ticket creation. Text was simply cut off and rendered subjects and ticket body fairly unreadable.

Encoding issues are not nice, and hard to track down. We rolled back the security fix upgrade, and hoped it would simply fix the issue. It did not, even our production version 4.4.1 now led into this error.
Our first idea was that our Docker image build somehow changes the locale, but that would have at least rendered „strange“ text, not entirely cut off. Same goes for the Apache webserver encoding. We’ve then started comparing the database schema, but was not touched in these regards too.

DBD::Mysql UTF8 Encoding Changes

During our research we learned that there is a patch available which avoids Perl’s DBD::mysql in version 4.042. The description says something about changed behaviour with utf8 encoding. Moving from RT to DBD::Mysql’s Changelog there is a clear indication that they’ve fixed a long standing bug with utf8 encoding, but that probably renders all other workarounds in RT and other applications unusable.

2016-12-12 Patrick Galbraith, Michiel Beijen, DBI/DBD community (4.041_1)
* Unicode fixes: when using mysql_enable_utf8 or mysql_enable_utf8mb4,
previous versions of DBD::mysql did not properly encode input statements
to UTF-8 and retrieved columns were always UTF-8 decoded regardless of the
column charset.
Fix by Pali Rohár.
Reported and feedback on fix by Marc Lehmann
(https://rt.cpan.org/Public/Bug/Display.html?id=87428)
Also, the UTF-8 flag was not set for decoded data:
(https://rt.cpan.org/Public/Bug/Display.html?id=53130)


Solution

Our build system for the RT container pulls in all required Perl dependencies by a cpanfile configuration. Instead of always pulling the latest version for DBD::Mysql, we’ve now pinned it to the last known working version 4.0.41.

 # MySQL
-requires 'DBD::mysql', '2.1018';
+# Avoid bug with utf8 encoding: https://issues.bestpractical.com/Ticket/Display.html?id=32670
+requires 'DBD::mysql', '== 4.041';

Voilá, NETWAYS and Icinga RT production instances fixed.

Conclusion

RT 4.4.2 will fix that by explicitly avoiding the DBD::Mysql version in its dependency checks, but older installations may suffer from that problem in local source builds. Keep that in mind when updating your production instances. Hopefully a proper fix can be found to allow a smooth upgrade to newer library dependencies.
If you need assistance with building your own Request Tracker setup, or having trouble fixing this exact issue, just contact us 🙂

Documentation matters or why OSMC made me write NSClient++ API docs

Last year I learned about the new HTTP API in NSClient++. I stumbled over it in a blog post with some details, but there were no docs. Instant thought „a software without docs is crap, throw it away“. I am a developer myself, and I know how hard it is to put your code and features into the right shape. And I am all for Open Source, so why not read the source code and reverse engineer the features.
I’ve found out many things, and decided to write a blog post about it. I just had no time, and the old NSClient++ documentation was written in ASCIIDoc. A format which isn’t easy to write, and requires a whole lot knowledge to format and generate readable previews. I skipped it, but I eagerly wanted to have API documentation. Not only for me when I want to look into NSClient++ API queries, but also for anyone out there.
 

Join the conversation

I met Michael at OSMC 2016 again, and we somehow managed to talk about NSClient++. „The development environment is tricky to setup“, I told him, „and I struggle with writing documentation patches in asciidoc.“. We especially talked about the API parts of the documentation I wanted to contribute.
So we made a deal: If I would write documentation for the NSClient++ API, Michael will go for Markdown as documentation format and convert everything else. Michael was way too fast in December and greeted me with shiny Markdown. I wasn’t ready for it, and time goes by. Lately I have been reviewing Jean’s check_nscp_api plugin to finally release it in Icinga 2 v2.7. And so I looked into NSClient++, its API and my longstanding TODO again.
Documentation provides facts and ideally you can walk from top to down, and an API provides so many things to tell. The NSClient API has a bonus: It renders a web interface in your browser too. While thinking about the documentation structure, I could play around with the queries, online configuration and what not.
 

Write and test documentation

Markdown is a markup language. You’ll not only put static text into it, but also use certain patterns and structures to render it in a beautiful representation, just like HTML.
A common approach to render Markdown is seen on GitHub who enriched the original specification and created „GitHub flavoured Markdown„. You can easily edit the documentation online on GitHub and render a preview. Once work is done, you send a pull request in couple of clicks. Very easy 🙂


If you are planning to write a massive amount of documentation with many images added, a local checkout of the git repository and your favourite editor comes in handy. vim handles markdown syntax highlighting already. If you have seen GitHub’s Atom editor, you probably know it has many plugins and features. One of them is to highlight Markdown syntax and to provide a live preview. If you want to do it in your browser, switch to dillinger.io.

NSClient++ uses MKDocs for rendering and building docs. You can start an mkdocs instance locally and test your edits „live“, as you would see them on https://docs.nsclient.org.

Since you always need someone who guides you, the first PR I sent over to Michael was exactly to highlight MKDocs inside the README.md 🙂
 

Already have a solution in mind?

Open the documentation and enhance it. Fix a typo even and help the developers and community members. Don’t move into blaming the developer, that just makes you feel bad. Don’t just wait until someone else will fix it. Not many people love to write documentation.
I kept writing blog posts and wiki articles as my own documentation for things I found over the years. I once stopped with GitHub and Markdown and decided to push my knowledge upstream. Every time I visit the Grafana module for Icinga Web 2 for example, I can use the docs to copy paste configs. Guess what my first contribution to this community project was? 🙂
I gave my word to Michael, and you’ll see how easy it is to write docs for NSClient++ – PR #4.


Lessions learned

Documentation is different from writing a book or an article in a magazine. Take the Icinga 2 book as an example: It provides many hints, hides unnecessary facts and pushes you into a story about a company and which services to monitor. This is more focussed on the problem the reader will be solving. That does not mean that pure documentation can’t be easy to read, but still it requires more attention and your desire to try things.
You can extend the knowledge from reading documentation by moving into training sessions or workshops. It’s a good feeling when you discuss the things you’ve just learned at, or having a G&T in the evening. A special flow – which I cannot really describe – happens during OSMC workshops and hackathons or at an Icinga Camp near you. I always have the feeling that I’ve solved so many questions in so little time. That’s more than I could ever write into a documentation chapter or into a thread over at monitoring-portal.org 🙂
Still, I love to write and enhance documentation. This is the initial kickoff for any howto, training or workshop which might follow. We’re making our life so much easier when things are not asked five times, but they’re visible and available as URL somewhere. I’d like to encourage everyone out there to feel the same about documentation.
 

Conclusion

Ever thought about „ah, that is missing“ and then forgot to tell anyone? Practice a little and get used to GitHub documentation edits, Atom, vim, MkDocs. Adopt that into your workflow and give something back to your open source project heroes. Marianne is doing great with Icinga 2 documentation already! Once your patch gets merged, that’s pure energy, I tell you 🙂
I’m looking forward to meet Michael at OSMC 2017 again and we will have a G&T together for sure. Oh, Michael, btw – you still need to join your Call for Papers. Could it be something about the API with a link to the newly written docs in the slides please? 🙂
PS: Ask my colleagues here at NETWAYS about customer documentation I keep writing. It simply avoids to explain every little detail in mails, tickets and whatnot. Reduce the stress level and make everyone happy with awesome documentation. That’s my spirit 🙂

Flexible and easy log management with Graylog

This week we had the pleasure to welcome Jan Doberstein from Graylog. On Monday our consulting team and myself attended a Graylog workshop held by Jan. Since many of us are already familiar with log management (e.g. Elastic Stack), we’ve skipped the basics and got a deep-dive into the Graylog stack.
You’ll need Elasticsearch, MongoDB and Graylog Server running on your instance and then you are good to go. MongoDB is mainly used for caching and sessions but also as user storage e.g. for dashboards and more. Graylog Server provides a REST API and web interface.
 

Configuration and Inputs

Once you’ve everything up and running, open your browser and log into Graylog. The default entry page greets you with additional tips and tricks. Graylog is all about usability – you are advised to create inputs to send in data from remote. Everything can be configured via the web interface, or the REST API. Jan also told us that some more advanced settings are only available via the REST API.


If you need more input plugins, you can search the marketplace and install the required one. Or you’ll create your own. By default Graylog supports GELF, Beats, Syslog, Kafka, AMQP, HTTP.
One thing I also learned during our workshop: Graylog also supports Elastic Beats as input. This allows even more possibilities to integrate existing setups with Icingabeat, filebeat, winlogbeat and more.
 

Authentication

Graylog supports „internal auth“ (manual user creation), sessions/tokens and also LDAP/AD. You can configure and test that via the web interface. One thing to note: The LDAP library doesn’t support nested groups for now. You can create and assign specific roles with restrictions. Even multiple providers and their order can be specified.


Streams and Alerts

Incoming messages can be routed into so-called „streams“. You can inspect an existing message and create a rule set based on these details. That way you can for example route your Icinga 2 notification events into Graylog and correlate events in defined streams.


Alerts can be defined based on existing streams. The idea is to check for a specific message count and apply threshold rules. Alerts can also be reset after a defined grace period. If you dig deeper, you’ll also recognise the alert notifications which could be Email or HTTP. We’ve also discussed an alert handling which connects to the Icinga 2 API similar to the Logstash Icinga output. Keep your fingers crossed.


Dashboards

You can add stream message counters, histograms and more to your own dashboards. Refresh settings and fullscreen mode are available too. You can export and share these dashboards. If you are looking for automated deployments, those dashboards can be imported via the REST API too.


Roadmap

Graylog 2.3 is currently in alpha stages and will be released in Summer 2017. We’ve also learned that it will introduce Elasticsearch 5 as backend. This enables Graylog to use the HTTP API instead of „simulating“ a cluster node at the moment. The upcoming release also adds support for lookup tables.
 

Try it

I’ve been fixing a bug inside the Icinga 2 GelfWriter feature lately and was looking for a quick test environment. Turns out that the Graylog project offers Docker compose scripts to bring up a fully running instance. I’ve slightly modified the docker-compose.yml to export the default GELF TCP input port 12201 on localhost.
vim docker-compose.yml
version: '2'
services:
mongo:
image: "mongo:3"
elasticsearch:
image: "elasticsearch:2"
command: "elasticsearch -Des.cluster.name='graylog'"
graylog:
image: graylog2/server:2.2.1-1
environment:
GRAYLOG_PASSWORD_SECRET: somepasswordpepper
GRAYLOG_ROOT_PASSWORD_SHA2: 8c6976e5b5410415bde908bd4dee15dfb167a9c873fc4bb8a81f6f2ab448a918
GRAYLOG_WEB_ENDPOINT_URI:
depends_on:
- mongo
- elasticsearch
ports:
- "9000:9000"
- "12201:12201"


docker-compose up

 
Navigate to http://localhost:9000/system/inputs (admin/admin) and add additional inputs, like „Gelf TCP“.
I just enabled the „gelf“ feature in Icinga 2 and pointed it to port 12201. As you can see, there’s some data running into. All screenshots above have been taken from that demo too 😉


More?

Jan continued the week with our official two day Graylog training. From a personal view I am really happy to welcome Graylog to our technology stack. I’ve been talking about Graylog with Bernd Ahlers at OSMC 2014 and now am even more excited about the newest additions in v2.x. Hopefully Jan joins us for OSMC 2017, Call for Papers is already open 🙂
My colleagues are already building Graylog clusters and more integrations. Get in touch if you need help with integrating Graylog into your infrastructure stack 🙂

OSDC 2017: Community connects

After a fully packed and entertaining first day at OSDC, we really enjoyed the evening event at Umspannwerk Ost. Warm weather, tasty food and lots of interesting discussions, just relaxing a bit and preparing for day 2 🙂
 

Warming up

Grabbed a coffee and started with Julien Pivotto on Automating Jenkins. Continuous integration matters these days and there’s not only Jenkins but also GitLab CI and more. Julien told us why automation for Jenkins is needed. Likewise, „XML Everywhere“ makes configuration a bit tad hard. Same thing goes for plugins, you literally can’t run Jenkins without. Julien also told us „don’t edit XML“, but go for example for Groovy and the Jenkins /script API endpoint. The Jenkins pipeline plugin even allows to use YAML as config files. In terms of managing the daemon, I learned about „init.groovy.d“ to manage and fire additional Groovy scripts. You can use the Job DSL Groovy plugin to define jobs in a declarative manner.
Julien’s talk really was an impressive deep dive leading to Jenkins running Docker and more production hints. After all an amazing presentation, like James said 🙂

At #OSDC @roidelapluie is giving an amazing comprehensive presentation on how to automate @jenkinsci

— James Just James (@purpleidea) May 18, 2017


I decided to stay in MOA5 for the upcoming talks and will happily await the conference archive once videos are uploaded in the next couple of days.
Casey Calendrello from CoreOS led us into the evolution of the container network interface. I’m still a beginner with containers, Kubernetes and also how networks are managed with it, so I learned quite a lot. CNI originates from rkt and is now built as separate project and library for Go-built software. Casey provided an impressive introduction and deep dive on how to connect your containers to the network – bridged, NAT, overlay networks and their pros and cons. CNI also provides many plugins to create and manage specific interfaces on your machine. It’s magic, and lots of mentioned tool names certainly mean I need to look them up and start to play to fully understand the capabilities 😉

Energetic delivery by @squeed at #OSDC pic.twitter.com/LbE2ha3jQt

— Felix Frank ? ‏ (@felis_rex) May 18, 2017


Yesterday Seth Vargo from HashiCorp had 164 slides and promised to just have 18 today, us moving to lunch soon. Haha, no – it is live demo time with modern secrets management with Vault. We’ve also learned that Vault was developed and run at HashiCorp internally for over a year. It received a security review by the NCC group before actually releasing it as open source. Generally speaking it is „just“ an encrypted key value store for secrets. Seth told us „our“ story – create a database password once, write it down and never change it for years. And the process to ask the DBA to gain access is so complicated, you just save the plain-text password somewhere in your home directory 😉
Live demo time – status checks and work with key creation. Manage PostgreSQL users and credentials with vault – wow, that simple? That’s now on the TODO list to play with too. Seth also released the magic Vault demo as open source on GitHub right after, awesome!

Wow. Manage #postgresql users and credentials with #vault – it just works 🙂 @sethvargo #osdc /mif pic.twitter.com/iTNYdIyHhC

— netways (@netways) May 18, 2017


Enjoying the afternoon

We had tasty lunch and were glad to see Felix Frank following up with „Is that an Ansible? Stop holding it like a Puppet!“ – hilarious talk title already. He provided an overview on the different architecture and naming schemas, community modules (PuppetForge, Ansible Galaxy) and also compared the configuration syntax (Hash-Like DSL, YAML). Both tools have their advantages, but you certainly shouldn’t enforce one’s mode onto the other.

OH @felis_rex "That's a thing which gets me a little wild." #namingthingsishard #ansible #puppetize #osdc pic.twitter.com/ixJwpng8Mc

— Michael Friedrich (@dnsmichi) May 18, 2017


Puh, I learned so many things today already. I’ve unfortunately missed Sebastian giving an introduction about our very own NETWAYS Web Services platform managed with Mesos and Marathon (I rest assured it was just awesome).
After a short coffee break we continued to make decisions – previously Puppet vs. Ansible, now VMware vs. Rudder, location-wise. I decided to listen to Dr. Udo Seidel diving into „VMware’s (Open Source) way of Container„. VMWare is traditionally not very open source friendly, but things are changing. Most likely you’ve heard about Photon OS serving as minimal container host. It was an interesting talk about possibilities with VmWare, but still, I left the talk with the „yet another platform“ feeling.
Last talk for a hilarious day about so many learnt things is about containerized DBs by Claus Matzinger from Crate.io. CrateDB provides shared nothing architecture and includes partitioning, auto-sharing, replication. It event supports structured and unstructured data plus SQL language. Sounds promising after all.
Dirk talked about Foreman as lifecycle management tool in MOA4, too bad I missed it.

"The usual intro applies: we are @netways, we are hiring, you know…all that jazz" – Dirk Götz at #OSDC pic.twitter.com/nj1hkCfxw4

— Felix Frank ? ‏ (@felis_rex) May 18, 2017


Conclusion

Coffee breaks and lunch unveiled so many interesting discussions. Food was really tasty and I’m sure everyone had a great time, so did I. My personal highlights this year: Follow-up Seth’s talk and try Consul and Vault and do a deep dive into mgmt and tell James about it. Learn more about Ansible and put it into context with Puppet, like Felix has shown in his talk. As always, I’m in love with Elastic beats and will follow closely how to log management evolves, also on the Graylog side of life (2.3 is coming soon, Jan and Bernd promised).
Many thanks to our sponsor Thomas Krenn AG for being with so long. And also for the tasty Linzer Torte – feels like home 🙂

Thank you @netways for the exciting #OSDC conference and for (OPEN)powering open source /wf pic.twitter.com/xa8s7cNda9

— Thomas-Krenn.AG (@ThomasKrennAG) May 18, 2017


Thanks for a great conference, safe travels home and see you all next year!
Save the date for OSDC 2018: 12. – 14.6.2018!