Beginning with events, our 8th Open Source Datacenter Conference (OSDC) and now the 3rd time in Berlin. Julia reported about the workshops and the general topics for the first and the second conference day while Michael summarized the program of day one and two.
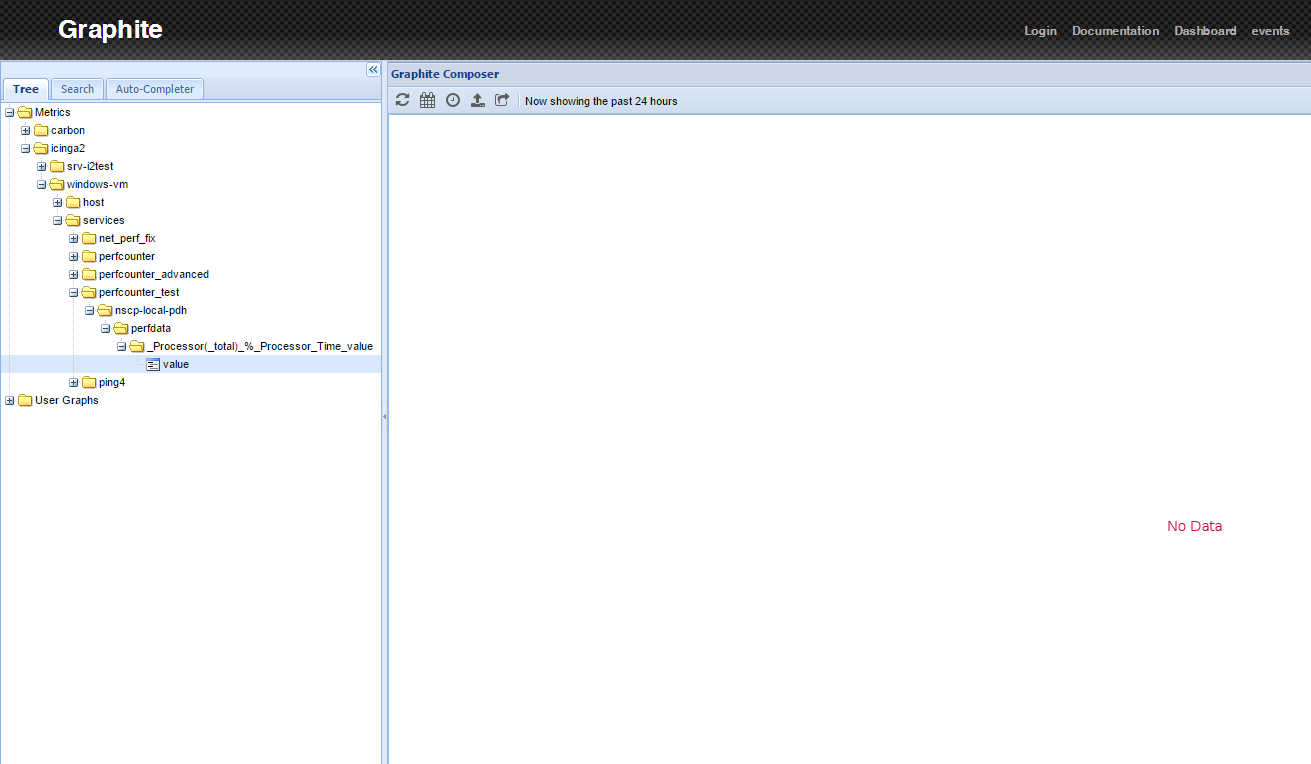
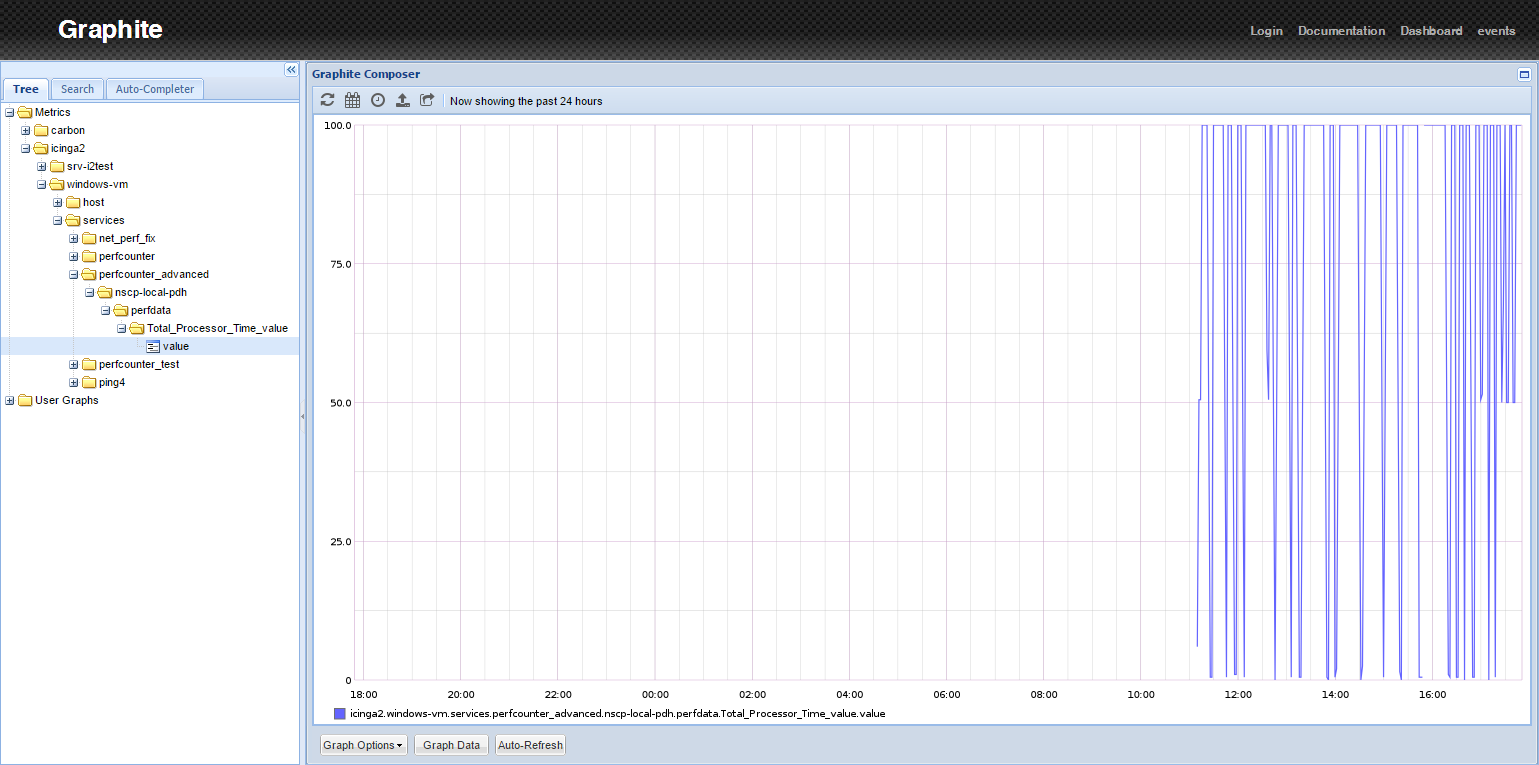
David then described Graphite installation under Debian 8.4 and Michael explained Windows performance counters with NSClient++ and Graphite.
Julia announced the new training concept for Icinga2 and Marius Gebert described why NETWAYS is awesome.
Lastly, Dirk introduced the official Foreman Training and Gunnar provided Avoiding Common Pitfalls with Apply Rules.
NETWAYS Blog
OSDC 2016 – Klappe, die erste
Montag, 25.04. 2016
Haben wir alles dabei? Haben wir auch wirklich nichts vergessen und an alles gedacht? Jaaaaa, wir haben alles! Und los geht’s zur OSDC 2016. Unser Events-Team und unsere Trainer reisten bereits am Montag ins Mercure Hotel MOA nach Berlin und bereiteten alles für die Workshops am Folgetag vor. Als dann alles aufgebaut war, haben wir uns – wie gewohnt – mit Essen belohnt. Nachdem unter anderem diverse 42 cm Pizzen verdrückt wurden, fielen alle zufrieden in Ihre Betten, voller Erwartungen an den nächsten Tag.
Dienstag, 26.04.2016
Der erste Tag der Konferenz startete mit unseren drei Intensiv-Workshops. Die Teilnehmer konnten zwischen Docker, Elastic Stack und Graphing wählen. Um 10 Uhr morgens ging es für alle los. Leckeres Essen in den Pausen brachte den Trainern und Teilnehmern die Kraft für die Intensiv-Workshops, ehe die restlichen NETWAYS Mitarbeiter im Hotel ankamen, um das Events-Team beim Aufbau für die Konferenz tatkräftig zu unterstützen.
Nach getaner Arbeit durften Teilnehmer, Trainer, Referenten und Mitarbeiter ein tolles gemeinsames Abendessen im Konferenzhotel genießen. Für die NETWAYS Crew ging es anschließend, in geordneten Zweierreihen versteht sich, Richtung Mitarbeiterhotel – natürlich nicht, ohne noch einen Stopp beim allseits beliebten “Tele-Inder”* einzulegen. Und da auf (starken) Durst bekanntlich der (Heiß-)Hunger folgt, lag es nahe, noch ein paar Schritte weiter zu gehen, um beim “Dönerturm” nach dem Rechten zu sehen… 😉
Redaktionelle Anmerkung
*Tele-Inder, der: Seines Zeichens rassiger Berliner Spätkauf, der den entwurzelten NETWAYSlern bei Widrigkeiten jedweder Art, aber auch in allen anderen Gemütslagen, gerne als heimelige Zuflucht in der fernen preußischen Hauptstadt dient.
Ready, Steady, Go! – OSDC 2016 got started with today's workshops
Endlich ist es soweit! Heiß ersehnt ist die OSDC 2016 heute Morgen um 10 Uhr gestartet. Derzeit laufen die drei Intesiv-Workshops auf Hochtouren:
Advanced Graphing – with Graphite & Co. mit Blerim Sheqa
Docker – Virtual Containers mit Sebastian Saemann und
Elastic Stack – Enterprise Logfile Management mit David Okon
Während die Teilnehmer vollständig in die Untiefen der jeweiligen (Workshop-)Materie abgetaucht sind, wird im Hintergrund alles zum Erhalt ihres leiblichen Wohls gegeben. Zwei aparte Kaffeepausen und ein tolles Mittagessen sollten zur Regeneration während der geistigen Höchstleistung das ihre beitragen 🙂
Die Workshops dauern noch bis 17 Uhr, danach ist maximal Entspannung und einfach nur Wohlfühlen in unserem Konferenzhotel angesagt!
Heute Abend geht es dann um 19 Uhr mit einem gemeinsamen Abendessen weiter. Zum Ausklang des ersten Tages und gleichzeitig als Einstimmung auf die kommenden beiden Konferenztage laden wir alle aller Teilnehmer (die das Package GOLD gebucht haben) und die bereits angereisten Referenten ein, in geselliger Runde erste Kontakte zu knüpfen, sich schon mal in die eine oder andere spannende Datencenter-basierte Diskussion verwickeln zu lassen, oder auch einfach über die Anreise und etwaige persönlichen Erwartungen an die Konferenz ins Gespräch zu kommen.
Wir freuen uns sehr, Euch alle zur Open Source Data Center Conference 2016 begrüßen zu dürfen und wünschen Euch einzigartige drei Tage voller interessanter Eindrücke, neuer Perspektiven, wertvoller Erkenntnisse und toller Gelegenheiten Euch untereinander kennen zu lernen, zu treffen und auszutauschen!
Windows performance counters with NSClient++ and Graphite
Windows performance counters have been there for ages. While modern interfaces such as WMI attempt to replace performance counters they still provide access to unique metrics. Fetching performance counters through NSClient++ is helped with the check_pdh query.
We’ve had an interesting issue with performance counters being received from a Windows client and then written to Graphite. The involved components in this setup are
- Icinga 2 as master
- GraphiteWriter feature enabled and Graphite running
- An Icinga 2 client on the windows machine checked via cluster config sync
- “nscp-local” CheckCommand objects for querying nscp.exe directly (config sync, global zone)
- NSClient++ installed on the Windows client
The Problem
Graphite Web refuses to display any value for that metric as seen in the screenshot. A similar problem is discussed at the monitoring portal (German).
While further analysing the problem we’ve come around this blog post. It did not help resolve the problem but provided insights on the problem within Graphite itself.
The culprit lies in the performance data label containing the “%” character. You will encounter similar issue with the “*” character. The filesystem does not allow to store and load these files.
There’s an issue on the Graphite bug tracker which targets dealing with special characters and better error handling.
The Solution
It may sound reasonable to remove such strings in the Carbon Cache backend, or use a shell wrapper for calling the nscp.exe and reformatting the returned metrics. Though those are just workarounds for the real issue.
At first glance we looked into perf-config but that only allows to modify the performance data label suffix. The documentation is still a TODO so it was more or less reading the source code and figuring out what other options are available.
In the end it turned out to be far more easy – Michael Medin, you’re a genius – perf-syntax provides the ability to just format your metrics as plugin performance data for your likings. The following example overrides the counter label to “Processor Time” – Graphite works again!
C:\Program Files (x86)\NSClient++>nscp.exe client --load-all --log info -b -q check_pdh counter="\Processor(_Total)\% Processor Time" perf-syntax="Processor Time" 11:02 OK: \Processor(_Total)\% Processor Time = 0|'Processor Time_value'=0;0;0
Icinga 2 Integration
The nscp-local CheckCommand definitions must be included by editing the icinga2.conf file on both the master and the client.
include <nscp-local>
If you prefer to use your own CheckCommand definition ensure to deploy it using a global zone defined on both the master and the client.
CheckCommand example:
object CheckCommand "nscp-local-pdh" { import "nscp-local" arguments += { "counter" = { value = "counter=$pdh_counter$" required = true skip_key = true } crit = { value = "crit=value > $pdh_crit$" skip_key = true } warn = { value = "warn=value > $pdh_warn$" skip_key = true } "perf-syntax" = { value = "perf-syntax=$pdh_perfsyntax$" skip_key = true } } vars.nscp_query = "check_pdh" vars.pdh_perfsyntax = "$pdh_counter$" }
Service apply example (via cluster config sync):
apply Service "perfcounter_test" { import "generic-service" check_command = "nscp-local-pdh" vars.pdh_counter = "\\Processor(_total)\\% Processor Time" vars.pdh_perfsyntax = "Total Processor Time" vars.pdh_warn = "1" vars.pdh_crit = "5" assign where host.address }
I’ve created an Icinga 2 issue for extending the Icinga 2 NSCP CheckCommands to provide the perf-config and perf-syntax natively.
More Hints
NSClient++ 0.4.2 changed the performance data label for counters and added the “_value” suffix. More recent versions allowed to override the suffix by defining the perf-config attribute. Although there is a bug which does not allow to remove the suffix. This should be fixed in the most recent stable release.
perf-config=*(suffix:none)
Conclusion
A tricky problem which probably affects a lot of users. A benefit of Open Source development – read the source, Luke 🙂
(Copyright by http://blog.codinghorror.com/learn-to-read-the-source-luke/)
To secure one of the last few remaining OSDC tickets you will have to be FAST & FURIOUS!
The Open Source Data Center Conference highlights current challenges and opportunities of open source software in data centers and huge IT environments, while covering the entire scope of OS data center solutions.
This year’s conference program is focused on the thematic topics INFRASTRUCTURE AS CODE, CONTAINERS AND DATABASES and TOOLS & INFRASTRUCTURE. Besides that, you can – as always – look forward to the the conferences’ second key feature: the great and exclusive opportunity for exchange of ideas and latest knowledge as well as in-depth discussions with other experienced professionals and well known experts in the field of OS data center solutions. To get a first impression, check out our evening event location as well as the relaxed and casual atmosphere provided by the conference venue.
The high class speaker line-up 2016 includes OS-experts as Jörg Schad, software engineer at Mesosphere, supporting the Apache Mesos Project; Monica Sarbu, creator of the Packetbeat open source project and team lead of the Beats inside Elastic; Jonathan Boulle, working at CoreOS; Dawn Foster, consultant at The Scale Factory; Kris Buytaert, one of the instigators of the devops movement, currently working for Inuits; Ján Lieskovský, software engineer at Red Hat and many more.
Secure your ticket now and profit from the comprehensive experience of international OS specialists, proven best practices and the get latest know-how for your daily practice!
If you are lucky you might even catch one of the strictly limited workshop seats, that are still available. Workshop topics are: ADVANCED GRAPHING – with Graphite, DOCKER – Virtual Containers and ELASTIC STACK – Enterprise Logfile Management.