Seite wählen

NETWAYS Blog

OSMC 2022 | Unifying Observability: Weaving Prometheus, Jaeger, and Open Source Together to Win

In his talk at the Open Source Monitoring Conference 2022 (OSMC) Jonah Kowall – having more than 15 years of experience in the fields Ops, network, security, and performance engineering under his belt – tells us a lot about observability in the open source market. He also focusses on possible problems regarding licensing.

In the following I will give you a brief overview of the topics and concepts behind.


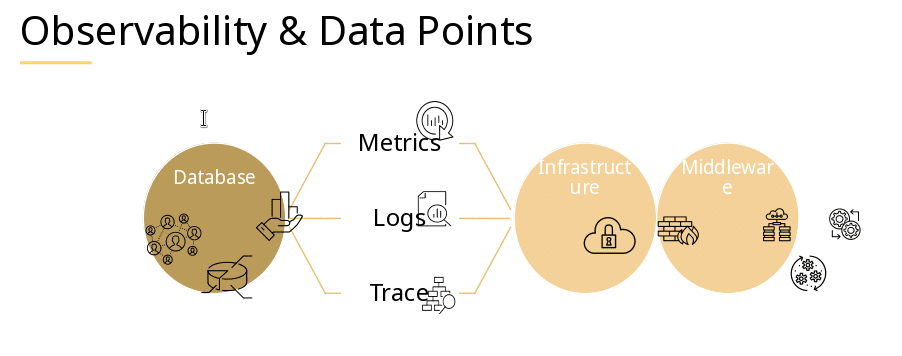
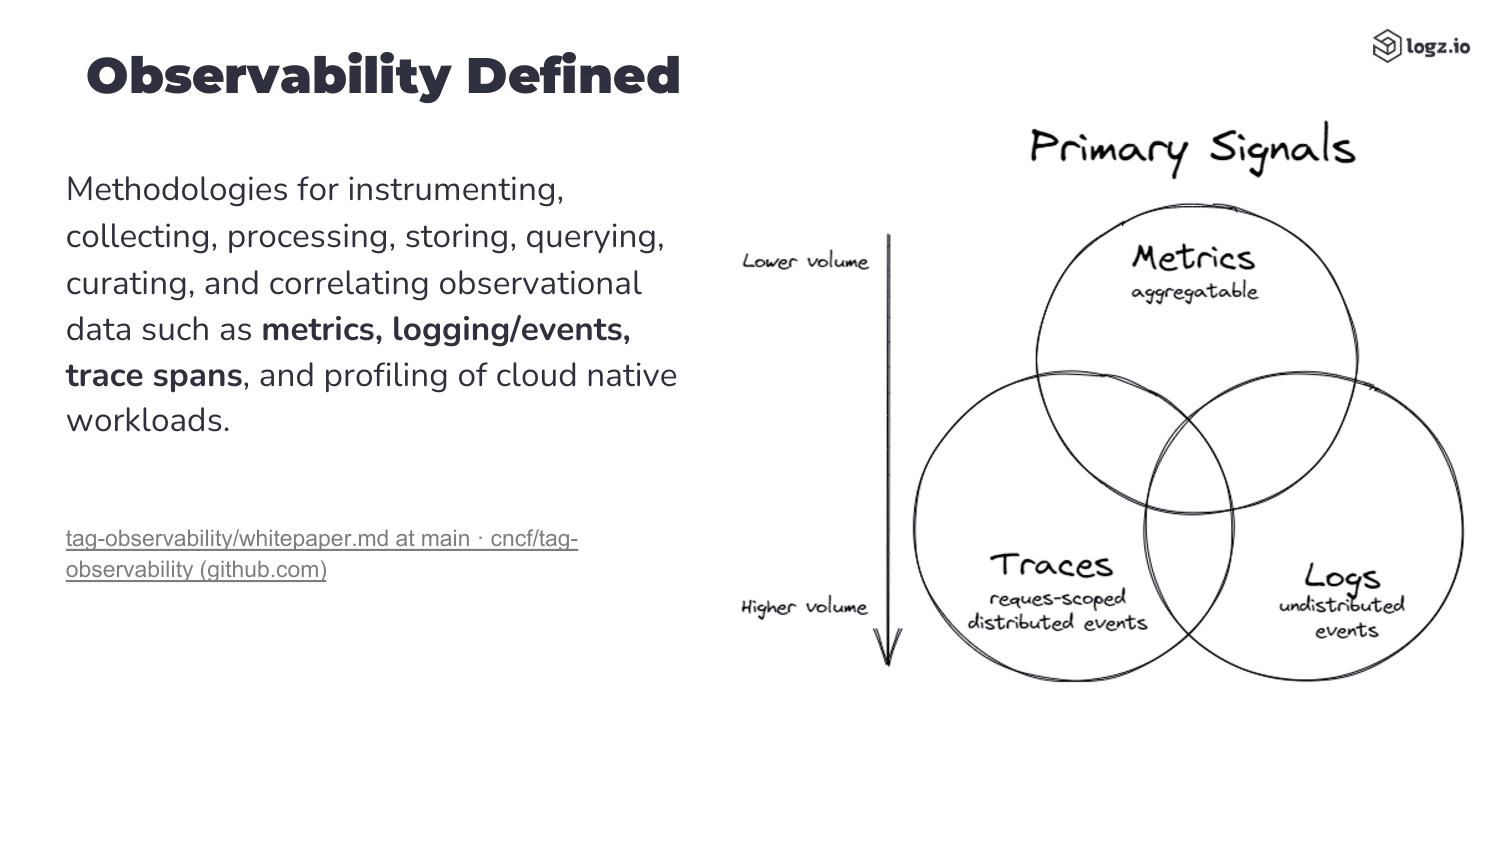
What is Observability?

First things first, what is observability? And how does it differ from monitoring?

To greatly simplify:

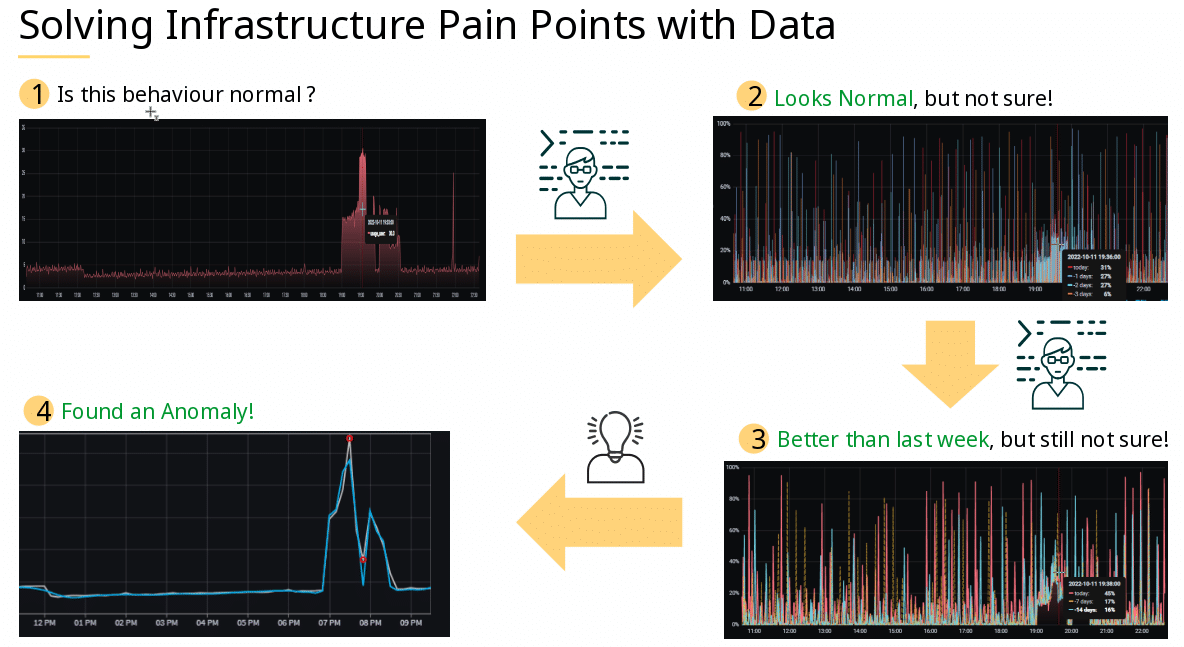
  • Monitoring is used to track specific criteria of given hosts/devices across your infrastructure. Thus, monitoring means having an eye on specific metrics such as CPU load or RAM usage. This enables you to notice problems as they occur and act accordingly.
  • Observability on the other hand means collecting “all” data. Based on the inputs a system receives and its respective outputs you are meant to be able to draw conclusions about your system’s state.

Sticking with the RAM example, monitoring can show you that your system runs low on memory, while observability can tell you why that is. This “why” is also helpful in order to act appropriately before the “that” happens. So, monitoring effectively follows a reactive approach and observability follows a proactive one.

Now let’s let his presentation give us an explanation.


Commercial vs. Open Source solutions

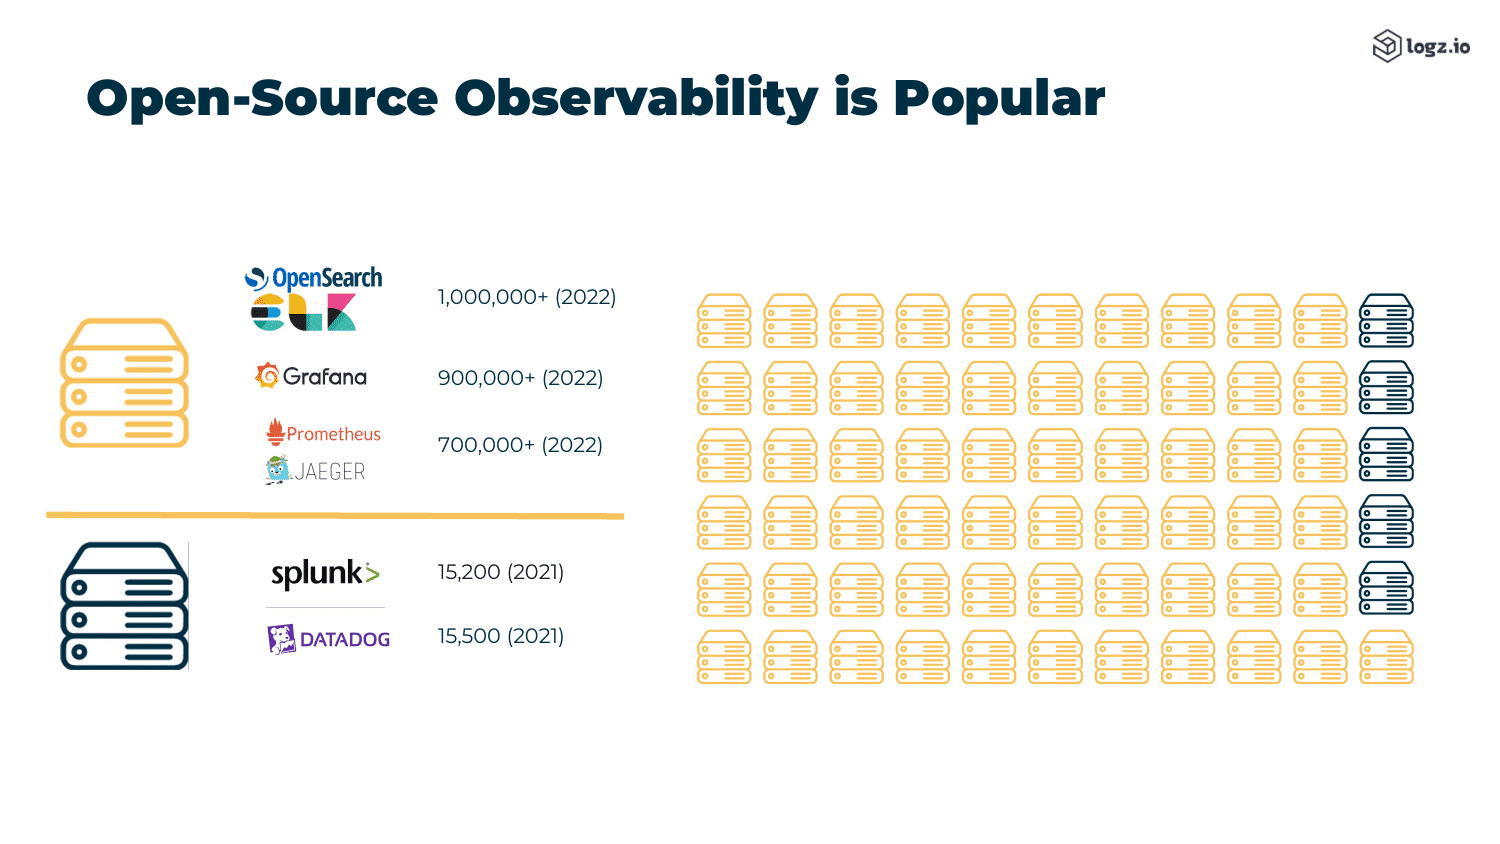
As Jonah goes on to explain, commercial tools for observability tend to be more coherent and complete out of the box when it comes to the user interface (UI).

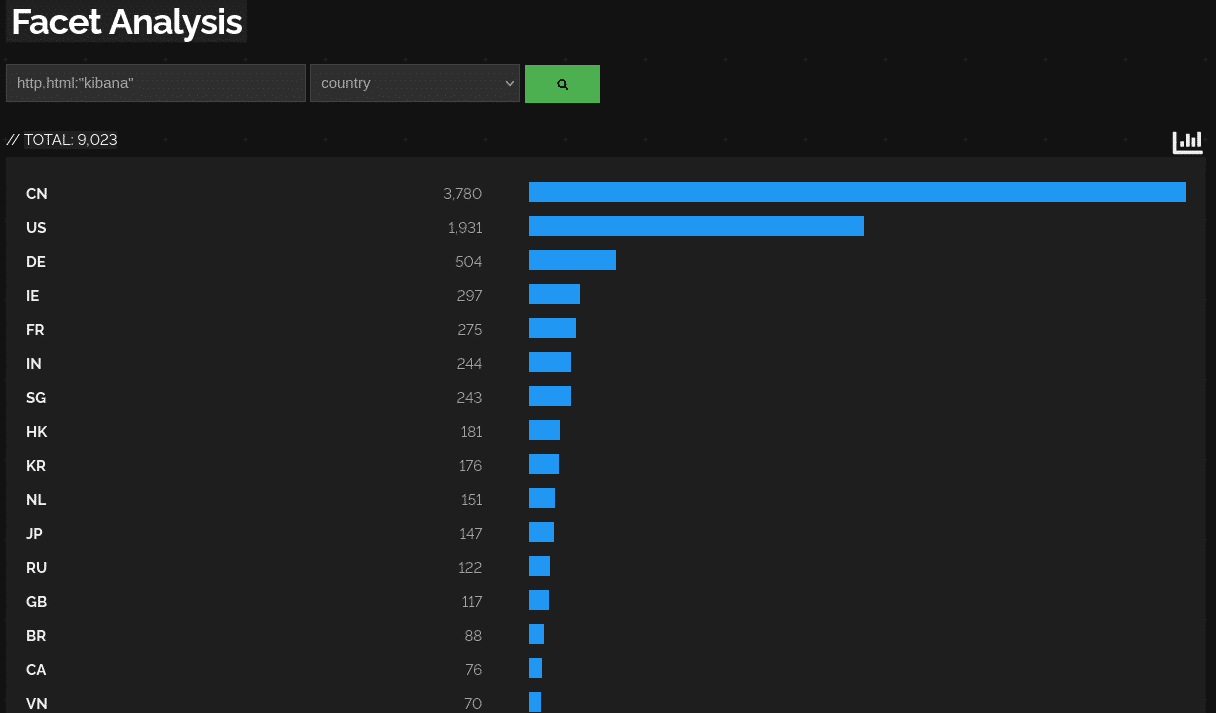
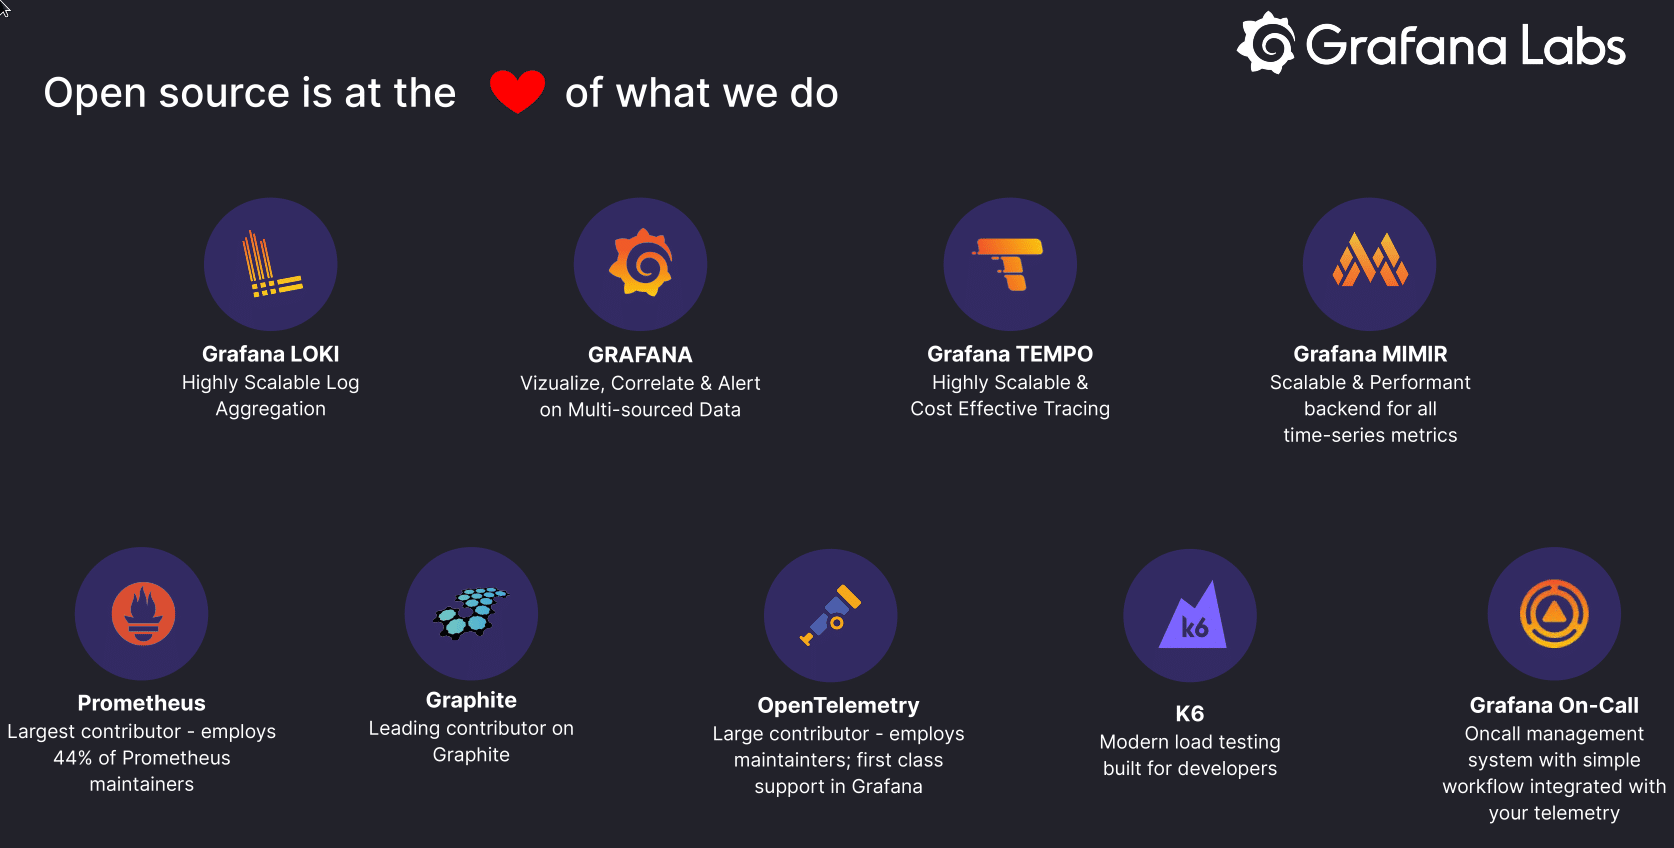
Meanwhile – due to the nature of the open source world – open source solutions are oftentimes highly fragmented requiring a combination of multiple tools to fill in the complete picture. This in turn leads to more complexity due to multiple different underlaying architectures. As an example he brings up the ELK stack (Elasticsearch + Logstash + Kibana) which is just three parts of a more extensive system.

But even though probably nobody likes complexity itself open source solutions still seem to be vastly popular with companies and make up the majority of the observability landscape. In Jonah’s opinion this trend is also “the future of where things are going”.


Licensing

Many of us are used to at least seeing a license every once in a while. MIT, Apache and GPL are common terms to encounter when dealing with open source products.
You yourself might not have to deal with licenses directly but in one way or another you could be affected as well.

Imagine finding a new open source project or code snippets that help you with building your own project. Maybe those fix something that you just could not do or didn’t have time to do. Now licensing is important. Can I use this code? In what way can I use it? Could it backfire? The last question is especially important, according to Jonah.

There seems to be a trend with so called “copyleft licenses”. In this context copyleft effectively means: If you use that code in your own project, you need to open source your own code within that project as well. This is certainly something most companies don’t want to or simply cannot afford to do. After all, companies are still about making money.

But not only do companies have to deal with such issues. Communities surrounding open source projects also have to be careful what they bring into projects. Amongst other disagreements – for example about the current path of a project – licensing is also a contributing factor when it comes to forks popping up.

If you want to know a bit more about a certain fork in the open source observability world that might potentially achieve unified observability, be sure to give Jonah Kowall a few minutes of your time.

The recording and slides of this talk and all other OSMC talks can be found in our Archives. Check it out!

The next OSMC takes place from November 7 – 9, 2023 in Nuremberg. Early Bird tickets are already on sale!

Matthias Döhler
Matthias Döhler
Junior Consultant

Über ein paar Umwege ist Matthias nun endlich da gelandet, wo er sich wohl fühlt: in der IT! Bei NETWAYS hat er im September 2021 seine Ausbildung zum Fachinformatiker für Systemintegration im Bereich Professional Services begonnen. Wenn er sich zu Hause nicht auch noch mit Themen rund um Linux auseinandersetzt, sieht er sich leidenschaftlich gerne Horrorfilme und solche an, die man als "Trash" bezeichnen könnte. Je seltsamer, desto besser! Den üblichen Beschäftigungen wie Freunde treffen, Bars aufsuchen oder die Sonne im Freien genießen, geht er eben so nach wie pseudophilosophischen Fragen. Daneben spielt er außerdem wahnsinnig gerne Videospiele vergangener Generationen....

How I met your C2 : Basic Operational Security for Defense and Offense

Throughout this blogpost I want to share some awareness on search engines and current trends of fingerprinting. Some parts have tags for defense and offense. In the following Black Hats are considered evil and destructive, whereas Red Teams simulate Black Hats, allowing organizations to test their effective defenses by Blue Teams.

Warning: Make sure to follow your countries jurisdiction on using Shodan and Censys. In most countries querying keywords is not an issue for public available data, as it is public and has been harvested and tagged by the search engine itself already. This is just like google dorking something like Grafana intitle:Grafana – Home inurl:/orgid, private Keys: site:pastebin.com intext:“—–BEGIN RSA PRIVATE KEY—–“ , or AWS Buckets: site:http://s3.amazonaws.com intitle:index.of.bucket .

Browser fingerprinting & custom malware

Sites like amiunique directly show how WebGL and other metadata tracks us. This is why TOR disables Javascript entirely and warns you about going fullscreen.

Offense:

Beef  and Evilgophish would be two OSS frameworks for fishing and victim browser exploitation, which have profiling included.

Defense:

You could use:
1) User Agent Spoofer for changing your Operating System
2) Squid in Paranoid Mode, to shred as many OS & hardware details as possible
3) Proxychains with Proxybroker to collect and rotate IPs. KASM allowing containerized throw away workspaces would also throw many attackers off conveniently.

Infrastructure tracking

Shodan has a list of filters to set, depending on your payment plan. Often advanced payment planes are not necessary (but you are limited to a number of queries/day), more so the correct hashes and keywords.

Recently Michal Koczwara a Threat Hunter, shared some great posts on targeting Black Hat infrastrastructure.

JARM TLS Fingerprinting

Firstly, what is a C2? It is a Command & Controll server that has Remote Code Execution over all the malware agents. Cobalt Strike is one of the top two C2 for Red Teamers and Black Hats. An analogy to monitoring would be an Icinga Master, which has visibility, alerting & code execution over multiple monitoring agents.

Defense:

Salesforce JARM is an amazing way to fingerprint the TLS handshaking method. This is because a TLS handshake is very unique, in addition to bundled TLS ciphers used. A basic Shodan query for this would be: ssl.jarm:“$ID-JARM“. Of course C2 developers could update their frameworks (but most don’t).

Below you see a query of Cobalt Strike JARM C2s and the top countries it is deployed in. Of course servers are individually visible too, but at this point I try to not leak the IPs.

.

This also works for Deimos C2, or any other C2.

You can find various lists of JARM hashes, and all you need to do is run JARM against an IP and port, to create your own lists. This could scale greatly tcpdump, Elastic or my little detector collecting IPs, and alert on the very first TCP connection (basically on the first stager phase of the malware, before any modules are pulled off the C2).

Offense:

Put your C2 behind a proxy, make sure to select a good C2 for operational security, and add randomization for the JARM.

Http.Favicon Hashes

For Favicons: Use Hash Calculators like this one here. This is quite common in bounty hunting to avoid Web Application Firewalls if the server has internet access without a full WAF tunnel. A basic Shodan query would be look this: http.favicon.hash:-$ID.

Http.html Hashes

There are even more OSINT indicators like those ones by BusidoUK which show http.html hashes impact on Metasploit http.html:“msf4″ or Miners http.html:“XMRig“. Some Black Hats or Red Teamers don’t even bother to put any authentication on their C2s at all?


Http.hml Hashes are brutal! You even find literally anything online, even defensive products like Nessus http.html:“nessus“

or Kibana http.html:“kibana“.

Fingerprinting Honeypots

Interestingly the chinese Version of Shodan, Zoomeye, is also offering fingerprinting honeypot detection in the VIP and Enterprise models. Some honeypots should really work on their Opsec, but of course this is an expensive cat and mouse game, and pull requests are always welcome right.

As of now I am diving more into honeypots with Elastic backends, and even complete Active Directory Honeypots, to help you as our customers more in the future.

In case you’re interested in consultancy services about Icinga 2, Elastic or another of our supported applications feel free to contact us at any time!


OSMC 2022 | AI Driven Observability based on Open Source

Observability and monitoring of resources are growing every day and it is inevitable to analyse all the data points to arrive at a solution. At Mercedes-Benz they have developed an Open Source data metric analyzer and drive it with data science to identify anomalies. At OSMC 2022, Satish Karunakaran, a data scientist with 19 years of experience in the field, presented how they established the entire data processing ecosystem based on Open Source.

In the beginning of his talk, Satish immediately questioned how much value can be generated manually out of Big Data, since metrics, logs and traces all provide intelligence. His point was not about scalability, management (manual patching) versus unmanaged (self-healing) here, but how to optimize for prediction and detection of failures.

Following up, the question arose what is normal, and how to determine normality versus abnormality.


Especially cases of „looks normal, but not sure“ or „better than last week, but something is wrong“ could be optimized with a data driven approach.

The idea is the following: 1) Collect lots of functional & correct data (as much as possible, as long as possible). 2a) Use lots of nested if conditions: Check if a value / limit ( 3 < 5 = yes ) has been reached, and if so, get more and more granular ( 3 < 4 =yes ) and split up based on previous choices (3 < 3 = false). This is also called a decision-tree. 2b ) Create labelling tags. 2c) Make this process highly parallel via scalable, distributed, gradient-boosted decision trees (XGBoost).

Boosting comes from the idea of improving single weak models by combining them with other weak models, in order to generate a strong model! Gradient boosting is an improved supervised learning variant if this, which takes labeled training data as input, and tries to correctly predict each training example – to label future data.

TLDR: If we know what is healthy, because if we have lots of healthy data, and are able to labelpredict each next data point to the real world (not necessarily watching what is happening, but predicting what will happen), and suddenly our predictions do not match, then we have an abnormality and should call an alert! Or, if you prefer to watch an AI explain XGBoost:

This morning I came across a cool demo by @LinusEkenstam about creating animated AI-generated characters. I decided to give it a try, and, with slight modifications, this is what I ended up with. pic.twitter.com/e2vx9OP0Ls

— Bojan Tunguz (@tunguz) January 18, 2023

Unfortunately compared to Neural Nets, XGBoost appears slow and memory intense with many decision-branches, wheares Neural Nets allow scalability and optimization – due to being able to optimize and drop for hidden functions. Additionally, one tries to converge for the maximum (XGBoost), and the other tries to converge for the minimum (Neural Nets). So combining both and getting the best possible tag tag-prediction is the art of someone who does this for quite a long time, like Satish!

An example of how Satish and his team implemented this can be seen in this picture, which displays the path of data flow, data orchestration and visualization.

Do you think all monitoring should follow an AI based anomaly approach?

Would you find it cool if all monitoring solutions one day would have predictive models? And how would they deal with statistical outliers? Maybe lots of human time wasted could be saved, if we could focus on „the essentials“? Would you like to hear more about about data science & AI at further NETWAYS Events or like to talk to Icinga developers about this fascinating topic? Please feel free to contact us!

The recording and slides of this talk and all other OSMC talks can be found in our Archives. Check it out! We hope to see you around at OSMC 2023! Stay in touch and subscribe to our Newsletter!

Squid – Mit Proxy schneller zum Ziel

Bereits in zwei meiner Blogposts habe ich besonders interessante Ausbildungsprojekte vorgestellt. Im Beitrag Your own Mini-NAS zeige ich, wie einfach es ist, einen Massenspeicher im eigenen Netzwerk zu erstellen, in Pi-Hole – das Urgestein der DNS-basierten Werbeblocker geht es, wie der Name schon vermuten lässt, um die Installation und Einrichtung von Pi-Hole auf einem Raspberry Pi.

Auch im heutigen Post geht es um ein für mich interessantes Ausbildungsprojekt aus meinem ersten Ausbildungsjahr zum Fachinformatiker für Systemintegration bei NETWAYS Professional Services: die Installation und Konfiguration eines Proxy-Servers mit Squid.

Was genau macht ein Proxy-Server?

Der Begriff „Proxy“ ist in vielen Bereichen der IT anzutreffen und für die meisten IT-Profis bereits ein alter Hut. Nichtsdestotrotz stelle ich einmal kurz und knapp die wichtigsten Anwendungsbereiche eines Proxy-Servers vor.

Caching – Beschleunigung beim Datenaufruf

Der wohl bekannteste Einsatzbereich von Proxys ist die Funktion als Zwischenspeicher. Dafür wird die entsprechende Software als „Mittelsmann“ in die Kommunikation von Host und Datacenter/Server eingesetzt. Jede Anfrage eines Hosts im Netzwerk, zum Beispiel der Aufruf einer Homepage über den Browser sowie die Antwort vom Server wird über den Proxy geleitet. Die eingehenden Daten werden in seinem Speicher ablegt, das nennt man Caching.
Durch das Caching ist der Proxy in der Lage, regelmäßig auftretende Anfragen deutlich schneller zu beantworten, da er viele Daten bereits aus seinem Speicher laden kann. So wird nicht nur Zeit, sondern auch Bandbreite gespart.

Lastenverteilung

Neben dem Caching, kann ein Proxy auch für eine bessere Lastenverteilung zwischen mehreren angeschlossenen Systemen sorgen. Diese Funktion kommt häufig bei Anfragen auf (Web-)Servern zum Einsatz. Um das einmal zu veranschaulichen, stellen wir uns eine beliebte Homepage vor, die pro Sekunde Tausende Anfragen bekommt. Damit der Webserver unter der Last nicht zusammenbricht, kommt ein Proxy zum Einsatz, der checkt, wie groß die Last auf Webserver 1 ist und bei Bedarf neue Anfragen auf Webserver 2 umleitet. Auf beiden Servern liegen die exakt gleichen Inhalte. So kann ein Zusammenbruch der Homepage verhindert werden.

Filterung des Datenverkehrs

Blocklisten sind eine einfach umsetzbare Möglichkeit den Datenverkehr innerhalb des eigenen Netzwerks zu reglementieren. Mit dem Squid Proxy-Server lassen sich diese Regeln einfach umsetzen, dazu weiter unten im Text aber noch mehr.
Der Administrator des Netzwerks kann mithilfe eines Proxy-Servers festlegen, welche Seiten aus dem eigenen Netzwerk aufgerufen werden können und welche nicht. Sobald eine „verbotene“ Website aufgerufen werden soll, kann eine Weiterleitung auf eine Landingpage genutzt werden, auf welcher diese Regeln erklärt sind.

Authentifizierung

Ähnlich wie die Listen zur Filterung von Datenverkehr kann mit Access Control Lists (ACL) der Zugang zum Netzwerk oder zu bestimmten Teilen des Netzwerks beschränkt oder freigeschalten werden. Dadurch kann anhand von IP’s und/oder MAC-Adressen sowie durch Authentifizierung exakt eingestellt werden, welche Systeme oder Nutzer auf welche Bereiche eines Netzwerks Zugriff bekommen.

Installation von Squid

DISCLAIMER: Alle in diesem Blogbeitrag genannten Installations- und Konfigurationsschritte wurden nur auf CentOS 9 getestet. Für andere Distributionen, besonders Debian / Ubuntu, wird keine Gewähr für eine problemlose Funktionalität gegeben.

Um einen Proxy zu konfigurieren benötigt es zunächst einmal die passende Open Source Software, in diesen Fall der häufig verwendete Squid Proxy Server. Die Installation von Squid selbst ist mit drei CLI-Befehlen so einfach wie unkompliziert.

yum -y install squid
systemctl start squid
systemctl enable squid

Um zu überprüfen, ob Squid Proxy wie gewünscht läuft, kann der aktuelle Status mit dem Command

systemctl status squid

angezeigt werden. Haben die hier gelisteten Parameter den gewünschten Status (active und enabled), kann die Konfiguration starten.

Konfiguration von Squid Proxy

Um kleinere Stolpersteine beim Einsatz von Squid direkt bei der Erstkonfiguration aus dem Weg zu räumen wird in der Firewall der von Squid benötigte Port 3128 freigeschaltet. Nun können die Zugriffsregelungen, Benutzerauthentifizierung sowie Blocklisten konfiguriert werden. In diesem Post beschränke ich mich auf die Konfiguration der Zugriffsregelungen sowie der Blocklisten.

Einrichten der Zugriffsregeln

Auf dem Proxy-Server

Bevor Authentifizierung und Listen genutzt werden können, muss der Zugriff auf den Squid-Proxy geregelt werden. Dafür werden die IP-Adressen der Hosts benötigt, die ihre Verbindungen über den Proxy-Server leiten sollen.
Die IP-Adressen können auf zwei verschiedene Arten bereitgestellt werden. Zum einen können sie mit dem entsprechenden Befehl direkt in die config-Datei von Squid geschrieben werden. Zum anderen kann eine eigene Textdatei mit allen relevanten Adressen angelegt und eingelesen werden. Letzteres Vorgehen ist besonders bei großen Netzwerken hilfreich und sinnvoll. Best Practice ist es, alle selbst erstellten Listen im Squid-Proxy-Ordner /etc/squid anzulegen.

Egal welche Methode genutzt wird, der entsprechende Befehl wird an den Anfang der Squid-Config-Datei geschrieben, damit die neue Direktive vor den bereits vordefinierten ACLs angewendet wird. Der entsprechende Befehl ist für die direkte Eingabe einer IP-Adresse

acl NAME_DER_ACL src IP_DES_SYSTEMS

und für die Verwendung einer Textdatei

acl NAME_DER_ACL dstdomain "PFAD_ZUR_TEXTDATEI"

Mit diesen Befehlen wurde eine neue ACL definiert, sie ist aber noch nicht aktiv. Dafür wird ein weiterer Befehl benötigt, der direkt unter den gerade geschriebenen Befehl eingefügt wird. Hier kann sowohl allow als auch deny genutzt werden, je nachdem, was das Ziel der neuen ACL ist, aber niemals beide zusammen in einem Befehl.

http_access allow NAME_DER_ACL
http_access deny NAME_DER_ACL

Auf den Clients im Netzwerk

Nachdem der Proxy-Server entsprechend konfiguriert ist, müssen auch auf den Clients, die den Proxy nutzen sollen, einige Anpassungen vorgenommen werden. In /etc/environment werden nun unabhängig vom bisherigen Inhalt der Datei die folgenden Zeilen eingefügt bzw. angepasst:

http_proxy=http://IP_DES_PROXY:3128/
https_proxy=http://IP_DES_PROXY:3128/
ftp_proxy=http://IP_DES_PROXY:3128/
no_proxy="localhost,127.0.0.1,localaddress,.localdomain"
HTTP_PROXY=http://IP_DES_PROXY:3128/
HTTPS_PROXY=http://IP_DES_PROXY:3128/
FTP_PROXY=http://IP_DES_PROXY:3128/
NO_PROXY="localhost,127.0.0.1,localaddress,.localdomain"

Damit sollten sowohl systemseitig als auch auf dem Proxy alle Konfigurationen für eine erfolgreiche Kommunikation der beiden durchgeführt sein.

Blocken von Websites und Keywords

Um eine Blockliste für Websites oder Keywords zu erstellen, müssen die zu sperrenden Seiten oder Begriffe in eigens dafür angelegten Textdateien gesammelt werden. Um welche zu sperrenden Inhalte es sich dabei handelt, ist von Anwendungsfall zu Anwendungsfall unterschiedlich. Häufig werden sie jedoch dafür genutzt, den Aufruf von Social Media-Kanälen zu beschränken, nicht-jugendfreie Inhalte aus dem Datenverkehr auszuschließen oder restriktiv alle Inhalte zu filtern, die für zu viel Ablenkung sorgen könnten.

Der Pfad zu den angelegten Listen, Best Bractice ist auch hier /etc/squid/…, wird nun in die squid.conf eingepflegt. Da die Konfigurationsdatei hierarchisch von oben nach unten abgearbeitet wird, MÜSSEN Blocklisten vor den Zugangsberechtigungen stehen.

acl blocked_sites dstdomain "PFAD_ZUR_EIGENEN_LINK-BLACKLIST"
acl blocked_keywords dstdomain "PFAD_ZUR_EIGENEN_KEY-BLACKLIST"
http_access deny blocked_sites
http_access deny blocked_keywords

Nachdem die Änderungen gespeichert wurden, ist noch ein Neustart von Squid-Proxy notwendig, um die Änderungen wirksam zu machen.

systemctl restart squid

Wenn alles korrekt eingerichtet wurde, ist der Squid-Proxy-Server nun einsatzbereit.

Die ersten Zeilen der veränderten squid.conf könnten nun in etwa so aussehen:

squid proxy configuration file with sample code

Wenn die eigene Konfigurationsdatei jedoch mehr oder weniger Inhalte beinhaltet oder diese in einer anderen Reihenfolge stehen, ist das kein Problem. Dieser Screenshot dient lediglich als Hilfestellung.

Ausbildung und #lifeatnetways

Wenn auch Du nun Lust bekommen hast, Dich mit diesem oder ähnlichen Projekten zu befassen oder bereits viel IT-Erfahrung mitbringst und direkt tiefer einsteigen willst, schick uns noch heute deine Bewerbung. Aktuell suchen wir besonders IT-Spezialist:innen in den verschiedensten Bereichen. Doch auch für das im September 2023 beginnende neue Lehrjahr kannst Du Dich bereits heute bewerben.
Wenn Du mehr über NETWAYS, freie Stellen oder unsere Firmenkultur erfahren willst, klick einfach auf den entsprechenden Link oder such auf Twitter, LinkedIn oder Instagram nach #lifeatnetways.

OSMC 2022 | The Power of Metrics, Logs & Traces with Open Source

In his talk at our Open Source Monitoring Conference OSMC Emil-Andreas Siemes showed how organisations can drastically reduce their MTTR (Mean Time To Repair) by using, integrating and correlating the Open Source tools Mimir, Loki & Tempo. He also talked about Open Source reliability testing to even avoid problems in the first place. And yes, with the use of Grafana. The moment Emil asked the crowd who uses Grafana, and I looked around, almost every single hand in the entire conference room was up.

Essentials on the Grafana Stack

Today Grafana labs employs over 1000 employees, improving observability. The core projects to pull this off are:

The Grafana Stack is also known as LGTM: Loki for logs, Grafana for visualization, Tempo for traces, and Mimir for metrics. In addition they employ 44 % of Prometheus maintainers, and provide the Grafana Mimir long term storage.

Grafana Faro

Emil emphasized the importance of OpenTelemetry which a standard for traces, metrics and logs (including metadata) and the way Tempo (traces) and Loki (log ingestion & aggregation) work together with Mimir. Another important point of the talk was a new way how Grafana Faro, an Open Source web SDK is able to provide frontend application observability!

Emil showed a Faro demo, and webvitals such as TTFB, FCP, CLS, LCP, FID were able to be picked up. This might be something very interesting for web and app developers in the future to improve and monitor their applications.

Improvements to Loki

Finally Emil discussed improvements to Loki, whose performance was significantly improved by 4x faster queries, and 50% less CPU power. Then LogQL was discussed and examples for Log & Metrics queries were shown, which should be quickly picked up by those familiar with PromQL.

Helping you get more observability

Overall the talk was a great way to get introduced and updated on the Grafana ecosystem. In case you need help to provide visibility and scaling to your ecosystem, at NETWAYS we provide consulting for integrating Grafana into your infrastructure. Feel free to contact us, and see you at the next event!

The recording and slides of this talk and all other OSMC talks can be found in our Archives. Check it out! We hope to see you around at OSMC 2023! Stay in touch and subscribe to our Newsletter!