Seite wählen

NETWAYS Blog

Graphite vs. IOPS – experience exchange

Last year, Blerim told us how to benchmark a Graphite and now we want to share some experience on how to handle the emerging IOPS with its pro and contra. It is important to know that Graphite can store its metrics in 3 different ways (CACHE_WRITE_STRATEGY). Each one of them influences another system resource like CPU, RAM or IO. Let us start with an overview about each option and its function.

max

The cache will keep almost all the metrics in memory and only writes the one with the most datapoints. Sounds nice and helps a lot to reduce the general and random io. But this option should never be used without the WHISPER_AUTOFLUSH flag, because most of your metrics are only available in memory. Otherwise you have a high risk of losing your metrics in cases of unclean shutdown or system breaks.
The disadvantage here is that you need a strong CPU, because the cache must sort all the metrics. The required CPU usage increases with the amount of cached metrics and it is important to keep an eye on enough free capacity. Otherwise it will slow down the processing time for new metrics and dramatically reduce the rendering performance of the graphite-web app.

naive

This is the counterpart to the max option and writes the metrics randomly to the disk. It can be used if you need to save CPU power or have fast storage like solid state disk, but be aware that it generates a large amount of IOPS !

sorted

With this option the cache will sort all metrics according to the number of datapoints and write the list to the disk. It works similar to max, but writes all metrics, so the cache will not get to big. This helps to keep the CPU usage low while getting the benefit of caching the metrics in RAM.
All the mentioned options can be controlled with the MAX_UPDATES_PER_SECOND, but each one will be affected in its own way.

Summary

At the end, we made use of the sorted option and spread the workload to multiple cache instances. With this we reduced the amount of different metrics each cache has to process (consistent-hashing relay) and find the best solution in the mix of MAX_UPDATES_PER_SECOND per instance to the related IOPS and CPU/RAM usage. It may sound really low, but currently we are running 15 updates per second for each instance and could increase the in-memory-cache with a low CPU impact. So we have enough resources for fast rendering within graphite-web.
I hope this post can help you in understanding how the cache works and generates the IOPS and system requirements.

Annotations in Grafana

Im Zuge der diesjährigen Open Source Monitoring Conference durfte ich mit Timeseries & Analysis with Graphite and Grafana einen der Workshops am Vortag der eigentlichen Konferenz halten. Wie man dem Titel unschwer entnehmen kann spielte dabei auch Grafana eine besondere Rolle. Grafana ist vielen als schöneres Dashboard für Graphite bekannt und unterstützt mit Elasticsearch, CloudWatch, InfluxDB, OpenTSDB, Prometheus, MySQL als auch Postgres in der aktuellen Version 4.6.2 allerdings noch eine ganze Reihe weiterer Datensourcen nativ. Zusätzlich können diese herkömmlichen Datensourcen auch noch durch Community Plugins ergänzt werden.
Ganz besonders hilfreich ist es wenn man die Informationen aus verschiedenen Datensourcen miteinander vereint. So lassen sich beispielsweise Zusammenhänge besser erkennen und Rückschlüsse auf bestimmte Ereignisse ziehen, die ansonsten vielleicht unentdeckt blieben. Metriken, die z.B. aus Graphite stammen, können bei Grafana nun durch sogenannte Annotations um zusätzliche Informationen angereichert werden. Neben Annotations aus den unterstützten Datensourcen können solche Events seit v4.6 übrigens auch direkt in der eigenen Grafana-Datenbank gespeichert werden, ob man das wiederum möchte ist allerdings eine ganz andere Frage…
Als Praxisbeispiel habe ich für meinen Workshop im Rahmen der OSMC überraschenderweise Icinga gewählt. Hier ist es möglich über die Icinga 2 API verschiedene Daten wie Checkergebnisse, Statusänderungen, Benachrichtigungen, Bestätigungen, Kommentare oder auch Downtimes mit dem Icingabeat direkt an Elasticsearch oder wenn man möchte alternativ auch an Logstash zu senden. Über das Annotation-Feature von Grafana lassen sich so die Benachrichtigungen aus Icinga über die Elasticsearch Datasource passend zu den jeweiligen Statusänderungen der Host- oder Serivcechecks einblenden:

Wer dazu mehr erfahren möchte dem kann ich unsere Graphite + Grafana Schulung ans Herz legen, neben vielen anderen Themen werden dort auch Grafana und Annotations in aller Ausführlichkeit behandelt. Und wer’s nicht schafft, für den findet sich vielleicht der ein oder andere passende Workshop im Rahmen unserer Konferenzen.

Markus Waldmüller
Markus Waldmüller
Head of Strategic Projects

Markus war bereits mehrere Jahre als Sysadmin in Neumarkt i.d.OPf. und Regensburg tätig. Nach Technikerschule und Selbständigkeit ist er nun Anfang 2013 bei NETWAYS als Senior Manager Services gelandet. Seit September 2023 kümmert er sich bei der NETWAYS Gruppe um strategische Projekte. Wenn er nicht gerade die Welt bereist, ist der sportbegeisterte Neumarkter mit an Sicherheit grenzender Wahrscheinlichkeit auf dem Mountainbike oder am Baggersee zu finden.

Most awaited OSMC is here!!

Hello! Your long wait is over and finally OSMC day starts. As the day begins with the following workshops Icinga 2 – Distributed Monitoring by Lennart Betz, Ansible – Configuration Management by Thilo Wening, Timesseries & Analysis with Graphite and Grafana by Markus Waldmüller and Elastic Stack – Modern Logfile Management by Thomas Widhalm. WOW! Lot more to know.
Bernd will kick start the Day 2 & 3 with so much exciting talks, Alba Ferri Fitó from Vodafone, Martin Schurz from T-Systems, Rihards Olups from Nokia, James Shubin from Red Hat and the long list of the speakers across the world. The day will follow by “evening event” where you can socialize with the fellow with the same interest.
Last day of conference is the “Hackathon Day”.
Download our OSMC App and Enjoy the conference.


Keya Kher
Keya Kher
Marketing Specialist

Keya ist seit Oktober 2017 in unserem Marketing Team. Nach ihrer Elternzeit ist sie seit Februar 2024 wieder zurück, um sich speziell um Icinga-Themen zu kümmern. Wenn sie sich nicht kreativ auslebt, entdeckt sie andere Städte oder schmökert in einem Buch. Ihr Favorit ist “The Shiva Trilogy”.  

Open Source Monitoring Conference 2017 – Last Ticket to grab!

The Open Source Monitoring Conference is the world’s leading interactive, community networking conference. This is your chance to network with more than 200 Open Source Monitoring community developers, system engineers, network engineers and IT managers from all over the world.
You will get a chance to hear and interact from around 34 expert speakers including Alba Ferri Fitó (Vodafone), Rihards Olups (Nokia), Martin Schurz (T-Systems), James Shubin (Red Hat), Holger Koch (DB Systel GmbH), Walter Heck (OlinData), Jan Doberstein (Graylog Inc), Bodo Schulz (CoreMedia) and many more.
The experts will get your insight with the cutting-edge agenda which will help you to gain actionable insight into 2017’s biggest challenges. For your food for brain, we announce last minutes shout out for all to grab the seat ticket. Get your ticket on www.osmc.de

Keya Kher
Keya Kher
Marketing Specialist

Keya ist seit Oktober 2017 in unserem Marketing Team. Nach ihrer Elternzeit ist sie seit Februar 2024 wieder zurück, um sich speziell um Icinga-Themen zu kümmern. Wenn sie sich nicht kreativ auslebt, entdeckt sie andere Städte oder schmökert in einem Buch. Ihr Favorit ist “The Shiva Trilogy”.  

Benchmarking Graphite

Before using Graphite in production, you should be aware of how much load it can handle. There is nothing worse than finding out your carefully planned and build setup is not good enough. If you are already using Graphite, you might want to know the facts of your current setup. Knowing the limits of a setup helps you to react on future requirements. Benchmarking is essential if you really want to know how many metrics you can send and how many requests you can make. To find this out, there are some tools out there that help you to run benchmarks.

Requirements

The most important thing you need when starting to benchmark Graphite is time. A typical Graphite stack has 3 – 4 different components. You need plenty of time to properly find out how much load each of them can handle and even more to decide which settings you may want to tweak.

Haggar

Haggar is a tool to simulate plenty of agents that send generated metrics to the receiving endpoint of a Graphite stack (carbon-cache, carbon-relay, go-carbon, etc…). The amount of agents and metrics is configurable, as well as the intervals. Even though Haggar does not consume much resources, you should start it on a separate machine.
Haggar is written in go and installed with the go get command. Ensure that Go (>= v1.8) is installed and working before installing Haggar.
Installing Haggar

go get github.com/gorsuch/haggar

You’ll find the binary in your GOPATH that you have set during the installation of Go previously.
Running Haggar:

$GOPATH/bin/haggar -agents=100 -carbon=graphite-server.example.com:2003 -flush-interval=10s -metrics=1000

Each agent will send 1000 metrics every 10 seconds to graphite-server.example.com on port 2003. The metrics are prefixed with haggar. by default. The more agents and metrics you send, the more write operations your Graphite server will perform.
Example output of Haggar:

root@graphite-server:/opt/graphite# /root/go/bin/haggar -agents=100 -carbon=graphite-server.example.com:2003 -flush-interval=10s -metrics=1000
2017/09/21 09:33:30 master: pid 16253
2017/09/21 09:33:30 agent 0: launched
2017/09/21 09:33:42 agent 1: launched
2017/09/21 09:33:46 agent 2: launched
2017/09/21 09:34:00 agent 0: flushed 1000 metrics
2017/09/21 09:34:02 agent 1: flushed 1000 metrics
2017/09/21 09:34:06 agent 2: flushed 1000 metrics

Testing the write performance is a good starting point, but it’s not the whole truth. In a production environment data is not only written but also read. For example by users staring at dashboards all day long. So reading the data is as much important as writing it because it also produces load on a server. This is where JMeter comes into play.

JMeter

Apache JMeter usually is used to test the performance of web applications. It has many options to simulate requests against a web server. JMeter can also be used to simulate requests against Graphite-Web. You should do this simultaneously while Haggar is sending data, so you have the “complete” simulation.
The easiest way to configure JMeter is the graphical interface. Running test plans is recommended on the command line, though. Here’s an example how I set up JMeter to run requests against Graphite-Web:

  • Add a Thread Group to the Test Plan
    • Set the Number of Threads (eg. 5)
    • Set the loop count to Forever
  • Add a Random Variable to the Thread Group
    • Name the variable metric
    • Set the minimum to 1
    • Set the maximum to 1000
    • Set `Per Thread` to true
  • Add another Random Variable to the Thread Group
    • Name the variable agent
    • Set the minimum to 1
    • Set the maximum to 100
    • Set Per Thread to true

Haggar uses numbers to name it’s metrics. With these variables we can create dynamic requests.

  • Add a HTTP Request Defaults to the Thread Group
    • Set the server name or IP where your Graphite-Web is running (eg. graphite-server.example.com)
    • Add the path /render to access the rendering API of Graphite-Web
    • Add some parameters to the URL, examples:
      • width: 586
      • height: 308
      • from: -30min
      • format: png
      • target: haggar.agent.${agent}.metrics.${metric}

The most important part about the request defaults is the target parameter.

  • Add a HTTP Request to the Thread Group
    • Set the request method to GET
    • Set the request path to /render
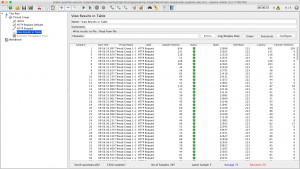
  • Add a View Results in Table to the Thread Group

The results table shows details of each request. On the bottom there is an overview of the count of all samples, the average time and deviation. Optionally you can also add a Constant Throughput Timer to the Thread Group to limit the requests per minute.
If everything is working fine, you can now start the test plan and it should fire lots of requests against your Graphite-Web. For verification, you should also look into the access logs, just to make sure.
At this point your Graphite server is being hit by Haggar and JMeter at the same time. Change the settings to find out at which point your server goes down.

Interpretation

Obviously, killing your Graphite server is not the point of running benchmarks. What you actually want to know is, how each component behaves with certain amounts of load. The good thing is, every Graphite component writes metrics about itself. This way you get insights about how many queries are running, how the cache is behaving and many more.
I usually create separate dashboards to get the information. For general information, I use collectd to monitor the following data:

  • Load, CPU, Processes, I/O Bytes, Disk Time, I/O Operations, Pending I/O Operations, Memory

The other dashboards depend on the components I am using. For carbon-cache the following metrics are very interesting:

  • Metrics Received, Cache Queues, Cache Size, Update Operations, Points per Update, Average Update Time, Queries, Creates, Dropped Creates, CPU Usage, Memory Usage

For carbon-relay you need to monitor at least the following graphs:

  • Metrics Received, Metrics Send, Max Queue Length, Attempted Relays, CPU Usage, Memory Usage

All other Graphite alternatives like go-carbon or carbon-c-relay also write metrics about themselves. If you are using them instead of the default Graphite stack, you can create dashboards for them as well.


Observing the behaviour during a benchmark is the most crucial part of it. It is important to let the benchmark do its thing for a while before starting to draw conclusions. Most of the tests will peak at the start and then calm after a while. That’s why you need a lot of time when benchmarking Graphite, every test you make will take its own time.

Performance Tweaks

Most setups can be tuned to handle more metrics than usual. This performance gain usually comes with a loss of data integrity. To increase the number of handled metrics per minute the amount of I/Ops must be reduced.
This can be done by forcing the writer (eg. carbon-cache) to keep more metrics in the memory and write many data points per whisper update operation. With the default carbon-cache this can be achieved by setting MAX_UPDATES_PER_SECOND to a lower value than the possible I/Ops of the server. Another approach is to let the kernel handle caching and allow it to combine write operations. The following settings define the behaviour of the kernel regarding dirty memory ratio.

  • vm.dirty_ratio (eg. 80)
  • vm.dirty_background_ratio (eg. 50)
  • vm.diry_expire_centisecs (eg. 60000)

Increasing the default values will lead to more data points in the memory and multiple data points per write operation.
The downside of these techniques is that data will be lost on hardware failure. Also, stopping or restarting the daemon(s) will take much longer, since all the data needs to be flushed to disk first.

Blerim Sheqa
Blerim Sheqa
COO

Blerim ist seit 2013 bei NETWAYS und seitdem schon viel in der Firma rum gekommen. Neben dem Support und diversen internen Projekten hat er auch im Team Infrastruktur tatkräftig mitgewirkt. Hin und wieder lässt er sich auch den ein oder anderen Consulting Termin nicht entgehen. Inzwischen ist Blerim als COO für Icinga tätig und kümmert sich dort um die organisatorische Leitung.