Select Page

NETWAYS Blog

OSMC 2021 | Open Source API-HUB – Connect Icinga2, Zabbix, CheckMK and more with OpenCelium

This entry is part 7 of 23 in the series OSMC 2021

OSMC 2021 has brought many insights into latest monitoring trends and we’re still amazed about that great on-site event last autmn. We’re happy to had a big amount of international attendees, 28 top-level speakers and not to forget our much valued sponsors on bord – in short: we’re grateful for everyone who made OSMC 2021 a special and an exciting event once again!

For all of you who would like to listen to last year’s experts sessions as a follow-up, I’ve created this blog series. It reminds you bi-weekly of one of our OSMC lectures including its video recording.

Today it’s all about Jakob Semre and his talk „Open Source API-HUB – Connect Icinga2, Zabbix, CheckMK and more with OpenCelium“.

Enjoy Jakob’s lecture!


YouTube player


If you’re already curious about what will await you at this year’s Open Source Monitoring Conference mark your calendars for November 14 – 16, 2022.

Grab your Early Bird ticket until June 30 and become part of an extraordinary open source event!

In case you have some great news to spread, you’re invited to join us as a speaker! Submit you paper for OSMC until July 31.


We’re looking forward to meeting you all again this autumn in Nuremberg.

Stay tuned!

Katja Kotschenreuther
Manager Marketing

Katja ist seit Oktober 2020 Teil des Marketing Teams. Als Manager Marketing kümmert sie sich hauptsächlich um das Marketing für die Konferenzen stackconf und OSMC sowie unsere Trainings. Zudem unterstützt sie das Icinga Team mit verschiedenen Social Media Kampagnen und der Bewerbung der Icinga Camps. Sie ist SEO-Verantwortliche für all unsere Websites und sehr viel in unserem Blog unterwegs. In ihrer Freizeit reist sie gerne, bastelt, backt und engagiert sich bei Foodsharing. Im Sommer kümmert sie sich außerdem um ihren viel zu großen Gemüseanbau.

OSMC 2021 | Scaling Naemon deployments to Kubernetes with Merlin

This entry is part 7 of 23 in the series OSMC 2021

OSMC 2021 has brought many insights into latest monitoring trends and we’re still amazed about that great on-site event last autmn. We’re happy to had a big amount of international attendees, 28 top-level speakers and not to forget our much valued sponsors on bord – in short: we’re grateful for everyone who made OSMC 2021 a special and an exciting event once again!

For all of you who would like to listen to last year’s experts sessions as a follow-up, I’ve created this blog series. It reminds you bi-weekly of one of our OSMC lectures including its video recording.

Today it’s all about Jacob Baungård Hansen and his talk „Scaling Naemon deployments to Kubernetes with Merlin“. He demonstrates how Merlin can be used to scale a Naemon deployment to multiple servers, including new functionality that allows deployment to Kubernetes and making use of Kubernetes autoscaling feature.

Enjoy Jacob’s lecture!


YouTube player


If you’re already curious about what will await you at this year’s Open Source Monitoring Conference mark your calendars for November 14 – 16, 2022.

Grab your Early Bird ticket until June 30 and become part of an extraordinary open source event!

In case you have some great news to spread, you’re invited to join us as a speaker! Submit you paper for OSMC until July 31.


We’re looking forward to meeting you all again this autumn in Nuremberg.
Stay tuned!

Katja Kotschenreuther
Manager Marketing

Katja ist seit Oktober 2020 Teil des Marketing Teams. Als Manager Marketing kümmert sie sich hauptsächlich um das Marketing für die Konferenzen stackconf und OSMC sowie unsere Trainings. Zudem unterstützt sie das Icinga Team mit verschiedenen Social Media Kampagnen und der Bewerbung der Icinga Camps. Sie ist SEO-Verantwortliche für all unsere Websites und sehr viel in unserem Blog unterwegs. In ihrer Freizeit reist sie gerne, bastelt, backt und engagiert sich bei Foodsharing. Im Sommer kümmert sie sich außerdem um ihren viel zu großen Gemüseanbau.

OSMC 2021 | Monitoring Open Infrastructure Logs – With Real Life Examples

This entry is part 6 of 23 in the series OSMC 2021

Last November OSMC 2021 took place. With me being part of NETWAYS since September 2021 it also has been my first OSMC. In the heart of Open Source many speakers talked about their experiences, shared knowledge and showcased what can be done in the field of monitoring using Open Source.
I have already given a little insight on another talk and would like to do so again.

Logs are a necessity

When it comes to IT infrastructure logs are an essential tool for us humans to understand what the machines are doing. They can tell you a lot about workloads, potential scaling needs and current problems.
Without logs we would not be able to “easily” adjust to changing circumstances and ever-growing demands.

That is where Marcelo Perazolo (IBM) comes in with his talk to tell us about Open Infrastructure Logs specifically.
Let me give you a brief overview about his talk.


Open Infrastructure Foundation / OpenInfra

The Open Infrastructure Foundation (OIF) was initially founded in 2012 to guide and lead the OpenStack project (called the OpenStack Foundation back then). OpenStack itself was started by NASA and Rackspace Technology in 2010 but has been joined by many companies by now.

Today Openstack is maintained by the OIF and the community revolving around OpenStack.

According to the OIF Open Infrastructure means the use of open alternatives for various forms of compute storage and networking. The different open source components should fit together to provide a flexible, scalable and ready to use environment that companies can rely on.


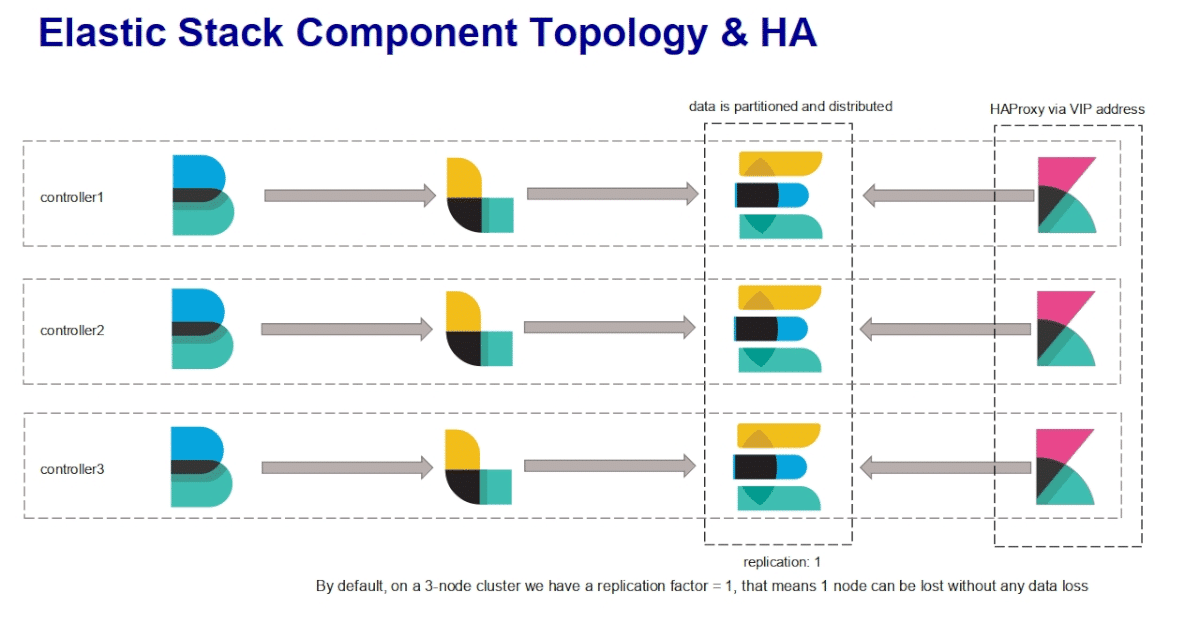
Elastic Stack Components

In his example Perazolo depicts a cluster consisting of three nodes, each of which has a controller that sends data to its own Logstash which in turn sends data to Elasticsearch.
There is also one Kibana instance per node. If an instance goes down however HAProxy will point to another instance ensuring that operations can still continue.


Requirements for log monitoring

Any log monitoring solution should provide the following:

  • must be able to collect millions of logs per day from different sources
  • ability to filter and streamline logs according to specific criteria
  • capability to visualize large quantities of data in a simple way
  • a way to essentially “zoom” into data changing from a simple overview to a close up view of specific data

The aforementioned Elastic Stack consisting of

  • Filebeat (for collecting logs)
  • Logstash (for filtering and streamlining data)
  • Elasticsearch (for high performance storage/querying)
  • Kibana (for flexible visualizations)

is one possible solution.


After Perazolo talked about the basic requirements and the chosen solution he goes on to explain best practices for collecting and transforming logs and also suggests a way on how to handle constantly growing amounts of logs.

If you would like to know more now, feel free to watch his talk and listen to Marcelo Perazolo for yourself.

Full talk and more from and about OSMC 2021

Watch the whole talk by Marcelo Perazolo here:

https://www.youtube.com/watch?enablejsapi=1&autoplay=0&cc_load_policy=0&cc_lang_pref=&iv_load_policy=1&loop=0&modestbranding=1&rel=1&fs=1&playsinline=0&autohide=2&hl=en_US&theme=dark&color=red&controls=1&" class="__youtube_prefs__ epyt-facade no-lazyload" data-epautoplay="1" >YouTube playerhttps://www.youtube.com/watch/maxresdefault.jpg" />


Since OSMC 2021 is unfortunately over we still have something for you: Did you already check out this year’s conference archives? They provide you slides and videos of each talk and also some photographs of the conference itself.

OSMC 2022 will take place from November 14 – 16 and we’re already looking forward  to meeting you all again!

Stay tuned!

Matthias Döhler
Matthias Döhler
Junior Consultant

Über ein paar Umwege ist Matthias nun endlich da gelandet, wo er sich wohl fühlt: in der IT! Bei NETWAYS hat er im September 2021 seine Ausbildung zum Fachinformatiker für Systemintegration im Bereich Professional Services begonnen. Wenn er sich zu Hause nicht auch noch mit Themen rund um Linux auseinandersetzt, sieht er sich leidenschaftlich gerne Horrorfilme und solche an, die man als "Trash" bezeichnen könnte. Je seltsamer, desto besser! Den üblichen Beschäftigungen wie Freunde treffen, Bars aufsuchen oder die Sonne im Freien genießen, geht er eben so nach wie pseudophilosophischen Fragen. Daneben spielt er außerdem wahnsinnig gerne Videospiele vergangener Generationen....

OSMC 2021 | Observability will not fix your broken Monitoring , or Culture

This entry is part 5 of 23 in the series OSMC 2021

OSMC 2021 has been over for almost three months now. It was a pretty interesting conference, and also my first one as a trainee at NETWAYS. The two-day conference including a workshop and hackathon was all about open source monitoring software like Icinga2, CheckMK or Prometheus.
Today I give you some insights about one of the talks:

About the Speaker

Kris Buytaert is a long time Linux and Open Source Consultant. He’s one of the instigators of the devops movement, currently working for Inuits. He is frequently speaking at or organizing different international conferences and has written about the same subjects in different Books, Papers and Articles. He spends most of his time working on bridging the gap between developers and operations with a strong focus on High Availability, Scalability, Virtualisation and Large Infrastructure Management projects hence trying to build infrastructures that can survive the 10th floor test, better known today as the cloud while actively promoting the devops idea!

The difference between Monitoring and Observability

Plenty of companies are jumping on a new hype train, Observability. The hope that is associated with the new technology: a replacement of the “legacy” monitoring stack.
In his talk Kris Buytaert took a look at this development and pointed out why it is a wrong approach for a lot of people. To understand the problems that could come up with the implementation of Observability, he first introduced the differences between Monitoring and Obervability.

What is Monitoring?

So what exactly is monitoring? Summarizied in one question: what is going on in my system?
With this question in mind, experts look at a system to figure out the following points (and some more):

– High level overview of the state of a service or component
– Availability of this services
– Technical components of your setup
– What is the performance of my setup

What is Observability?

Observability on the other hand is trying to answer the question: Why is this going on?
For example, your services behave in a way that they shouldn’t because you or your colleagues didn’t tell the system to do this. With the help of Observability software you could figure out why your tech is behaving the way it is.
In practice Observability consists of three pilars:
Metrics
Logs
Traces

Whats your goal in observability?

After the short introduction of the differences between monitoring and observability, Kris Buytaert showcased some examples of failed implementation of observability. What all of the situations have in common? There was no flawless instance of monitoring on which the observability was placed.

But why are an increasing number of companies who turn to observabilty and what’s the goal of of this development?

In his talk he listed some reasons he experienced himself when talking to companies and employees:

– Expectation of increasing performance problems
– Already existing performance problems
– The monitoring data is chaos, observability will fix it and give a better insight in what is running in the system
– More hipster credit (e.g. ‘Our company is so advanced. We take on every new trend to show how progressive we are.’)

The first steps of implementing observability

To end his talk, the speaker gave a few helpful first steps for everyone who is thining about implementing obervability.

1. Fix your monitoring. It can be an automated single source of truth about what is going on in your system.
2. Keep it GREEN!
3. Fix your metrics. Check if logshipping is partially broken, if theres a regression on shipping your metrics or if you have a broken dashboard.

Apart form the technical standpoint the speaker encourages everyone to ask some important questions before the implementation of a new system:

– Who exactly wants Observability? Is it the devs and ops or is it the upper management who insists on trying out something new.
– What do they really want? Do they really want Observability or are there other reasons they want it in your system.
– Will a new system fit into my existing ecosystem? If a vendor claims it works out of the box for everyone but your developers say it doesn’t…Trust your devs!

As the last words in his talk Kris Buytaert had some advice: ‘You might not need Observability (yet) but you do need to fix your monitoring.’


Full talk and more from and about OSMC 2021

Watch the whole talk by Kris Buytaert here:

YouTube player


Since OSMC 2021 is unfortunately over we still have something for you: Did you already check out this year’s conference archives? They provide you slides and videos of each talk and also some photographs of the conference itself.

OSMC 2022 will take place from November 14 – 16 and we’re already looking forward  to meeting you all again!

Stay tuned!

OSMC 2021 | Advanced MySQL optimization and troubleshooting using PMM 2

This entry is part 4 of 23 in the series OSMC 2021

Last November OSMC 2021 took place. With me being part of NETWAYS since September 2021 it also has been my first OSMC. In the heart of Open Source many speakers talked about their experiences, shared knowledge and showcased what can be done in the field of monitoring using Open Source.
I want to give you a small glimpse into one of the talks we have had.


The importance of data

In our modern age data is probably the most valuable resource on our planet when looking at it from a monetary point of view. Businesses big and small alike use data to guide their behaviour, make decisions and plan their future.

Long gone are the days where simple spreadsheets did suffice. Modern companies rely on databases and their efficiency to support their work processes, sometimes even making them possible in the first place.

In his talk at OSMC 2021 Peter Zaitsev, co-founder of Percona, discusses what certain parties want regarding databases, where problems may lie and he also offers a solution to some of the laid out problems.

For most developers a database should simply just work in a reliable fashion. It should be available when needed and deliver correct information in a timely manner.
Since time also means money efficiency becomes especially important to people in management who usually want any given database to cost as little money as possible.

Problems

Possible problems can arise in a lot of different spots. Imagine for example a developer who decides to query certain information every minute to make sure the data is up to date even though the specific information does not change that frequently.

Clearly this would put a lot of unnecessary load onto the database. That’s why looking at the application side is also important when optimizing databases.

Now let’s think of a different scenario where every application makes good queries. Even ideal circumstances on the application side do not guarantee that a database will run efficiently or even effectively.

Bad or faulty hardware – CPU, RAM and storage alike – can immensely decrease the efficiency of any database. Even good queries can run slowly on bad hardware.

Other processes besides database related ones can also take away performance that would otherwise be beneficial to the queries.

Simply the way a database is structured can also decrease its own efficiency.

A solution – PMM2

Percona Monitoring and Management (PMM) 2 addresses the aforementioned problems and helps identifying them.

PMM is an Open Source database monitoring solution that offers one singular place to monitor all of your databases. This is achieved by using one server and a client agent per system you want to monitor. In the web interface you can look at a dashboard with all the gathered information together with some visualizations.

Some of the information PMM shows:

  • the impact specific queries have over time
  • information about the database tables that a relevant to a certain query
  • the amount of load specific applications cause
  • the amount of rows searched through before a query delivers a result
  • CPU and memory utilization sorted by processes
  • disk I/O latency

Using the information PMM delivers you can identify oversubscribed queries and applications which cause a lot of load, predict future scaling needs and even find those databases that are just not structured in an efficient way to begin with.

If you want to know how all of this can look like their PMM demo can give you a good first impression.
For further information also check out their documentation or just go ahead and watch the talk.


Full talk and more from and about OSMC 2021

Watch the whole talk by Peter Zaitsev here:

https://www.youtube.com/watch?enablejsapi=1&autoplay=0&cc_load_policy=0&cc_lang_pref=&iv_load_policy=1&loop=0&modestbranding=1&rel=1&fs=1&playsinline=0&autohide=2&hl=en_US&theme=dark&color=red&controls=1&" class="__youtube_prefs__ epyt-facade no-lazyload" data-epautoplay="1" >YouTube playerhttps://www.youtube.com/watch/maxresdefault.jpg" />


Since OSMC 2021 is unfortunately over we still have something for you: Did you already check out this year’s conference archives? They provide you slides and videos of each talk and also some photographs of the conference itself.

OSMC 2022 will take place from November 14 – 16 and we’re already looking forward  to meeting you all again!

Stay tuned!

Matthias Döhler
Matthias Döhler
Junior Consultant

Über ein paar Umwege ist Matthias nun endlich da gelandet, wo er sich wohl fühlt: in der IT! Bei NETWAYS hat er im September 2021 seine Ausbildung zum Fachinformatiker für Systemintegration im Bereich Professional Services begonnen. Wenn er sich zu Hause nicht auch noch mit Themen rund um Linux auseinandersetzt, sieht er sich leidenschaftlich gerne Horrorfilme und solche an, die man als "Trash" bezeichnen könnte. Je seltsamer, desto besser! Den üblichen Beschäftigungen wie Freunde treffen, Bars aufsuchen oder die Sonne im Freien genießen, geht er eben so nach wie pseudophilosophischen Fragen. Daneben spielt er außerdem wahnsinnig gerne Videospiele vergangener Generationen....