- OSMC 2021 | Introduction into OpenSearch
- OSMC 2021 | pg_stat_monitor: A cool extension for better database (PostgreSQL) monitoring
- OSMC 2021 | On the Bleeding Edge of OpenTelemetry
- OSMC 2021 | Thola – A tool for monitoring and provisioning network devices
- OSMC 2021 | Advanced MySQL optimization and troubleshooting using PMM 2
- OSMC 2021 | Observability will not fix your broken Monitoring , or Culture
- OSMC 2021 | Monitoring Open Infrastructure Logs – With Real Life Examples
- OSMC 2021 | Scaling Naemon deployments to Kubernetes with Merlin
- OSMC 2021 | Open Source API-HUB – Connect Icinga2, Zabbix, CheckMK and more with OpenCelium
- OSMC 2021 | Icinga for Windows – Evolution
- OSMC 2021 | inspectIT Ocelot: Dynamic OpenTelemetry Instrumentation at Runtime
- OSMC 2021 | Still directing the director… and more!
- OSMC 2021 | Current State of Icinga
- OSMC 2021 | Icinga-Installer – Der einfache Weg zum eigenen Icinga
- OSMC 2021 | Open Source Application Performance Monitoring in the Enterprise
- OSMC 2021 | Use OpenSource monitoring for an Enterprise Grade Platform
- OSMC 2021 | Contributing to Open Source with the example of Icinga
- OSMC 2021 | Handling 250K flows per second with OpenNMS: a case study
- OSMC 2021 | Robotmk: You don’t run IT – you deliver services!
- OSMC 2021 | Monitoring Open Source Hardware
- OSMC 2021 | Secure Password Vaults with Naemon
- OSMC 2021 | Gamification of Observability
- OSMC 2021 | Observability is More than Logs, Metrics & Traces
Last November OSMC 2021 took place. With me being part of NETWAYS since September 2021 it also has been my first OSMC. In the heart of Open Source many speakers talked about their experiences, shared knowledge and showcased what can be done in the field of monitoring using Open Source.
I want to give you a small glimpse into one of the talks we have had.
The importance of data
In our modern age data is probably the most valuable resource on our planet when looking at it from a monetary point of view. Businesses big and small alike use data to guide their behaviour, make decisions and plan their future.
Long gone are the days where simple spreadsheets did suffice. Modern companies rely on databases and their efficiency to support their work processes, sometimes even making them possible in the first place.
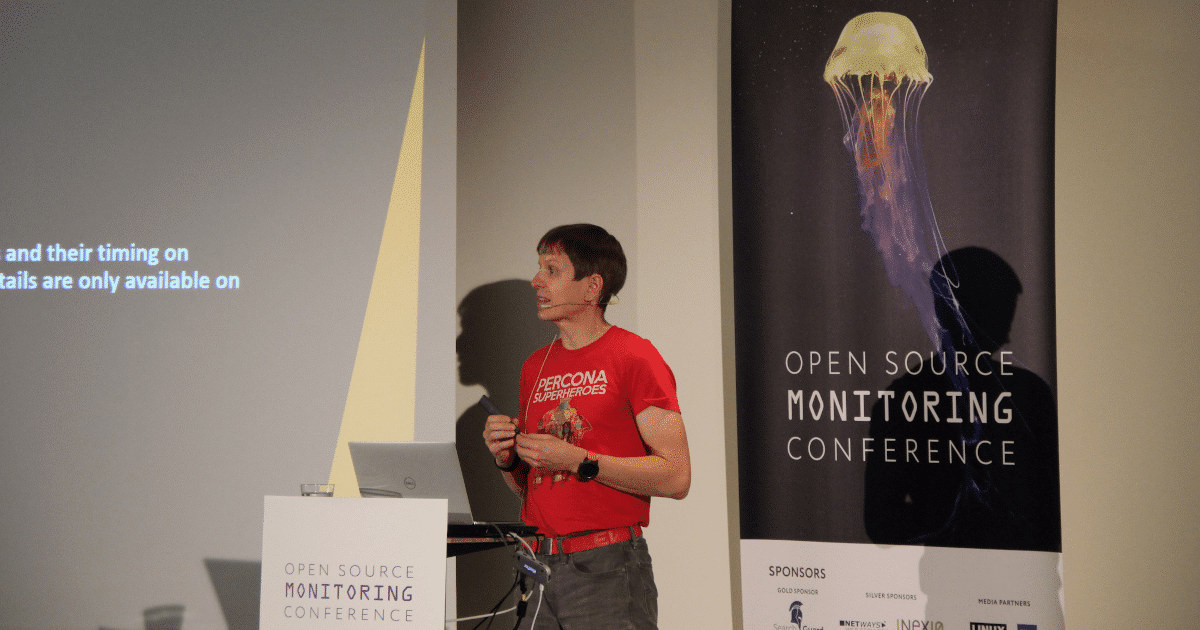
In his talk at OSMC 2021 Peter Zaitsev, co-founder of Percona, discusses what certain parties want regarding databases, where problems may lie and he also offers a solution to some of the laid out problems.
For most developers a database should simply just work in a reliable fashion. It should be available when needed and deliver correct information in a timely manner.
Since time also means money efficiency becomes especially important to people in management who usually want any given database to cost as little money as possible.
Problems
Possible problems can arise in a lot of different spots. Imagine for example a developer who decides to query certain information every minute to make sure the data is up to date even though the specific information does not change that frequently.
Clearly this would put a lot of unnecessary load onto the database. That’s why looking at the application side is also important when optimizing databases.
Now let’s think of a different scenario where every application makes good queries. Even ideal circumstances on the application side do not guarantee that a database will run efficiently or even effectively.
Bad or faulty hardware – CPU, RAM and storage alike – can immensely decrease the efficiency of any database. Even good queries can run slowly on bad hardware.
Other processes besides database related ones can also take away performance that would otherwise be beneficial to the queries.
Simply the way a database is structured can also decrease its own efficiency.
A solution – PMM2
Percona Monitoring and Management (PMM) 2 addresses the aforementioned problems and helps identifying them.
PMM is an Open Source database monitoring solution that offers one singular place to monitor all of your databases. This is achieved by using one server and a client agent per system you want to monitor. In the web interface you can look at a dashboard with all the gathered information together with some visualizations.
Some of the information PMM shows:
- the impact specific queries have over time
- information about the database tables that a relevant to a certain query
- the amount of load specific applications cause
- the amount of rows searched through before a query delivers a result
- CPU and memory utilization sorted by processes
- disk I/O latency
Using the information PMM delivers you can identify oversubscribed queries and applications which cause a lot of load, predict future scaling needs and even find those databases that are just not structured in an efficient way to begin with.
If you want to know how all of this can look like their PMM demo can give you a good first impression.
For further information also check out their documentation or just go ahead and watch the talk.
Full talk and more from and about OSMC 2021
Watch the whole talk by Peter Zaitsev here:
Since OSMC 2021 is unfortunately over we still have something for you: Did you already check out this year’s conference archives? They provide you slides and videos of each talk and also some photographs of the conference itself.
OSMC 2022 will take place from November 14 – 16 and we’re already looking forward to meeting you all again!







0 Comments