Seite wählen

NETWAYS Blog

Profiling your application with Valgrind Callgrind: Icinga2

We are using a variety of tools to ensure that our applications do not leak memory, suffer from performance issues or actually trigger unwanted behavior. This tool stack changes over time, and it is also different for web, script and binary applications. Next to the Icinga bits I am responsible for the LConf Backend and other Perl foo here at NETWAYS – I’ve already written about profiling Perl. During Icinga 1.x and 2.x development we’ve come around a couple of tools for profiling memory consumption with Massif or using the Google perftools.
One of our specialties at NETWAYS Development is further that we’re capable of identifying and resolving issues directly – be it performance, memory, locking, race conditions, etc. aside from the code we’re developing and running at customers.

The perfect code vs performance

While the perfect code does not exist, it’s always interesting and also required to refactor your own code parts based on current conditions and requirements. The code in 2.2.4 had one function interface being called, namely AddObject(). This function is merely doing the following for ‚repository add‘ and ’node update-config‘:

  • Get all the object names from `repository.d` and checking if the added object already exists
  • Create a new object by attributes and run it against the Icinga 2’s config validation
  • Check if the change already exists by reading the `changes` directory
  • Add the change to the changelog (for calling ‚commit‘ later on)

This is perfectly fine for keeping the same functionality shared among several occasions where this code is used. But we’ve run into severe performance issues with like 20000 calls to AddObject() inside one ’node update-config‘ run.

How to tackle the problem

Valgrind provides a tool named callgrind which tracks the function calls and time of a specific binary being run. While this is a bit slower than the Google perftools, it provides more detailed data. The ‚callgring.out.PID‘ file can then be visualized in KCacheGrind.
Install Valgrind alongside with KcacheGrind. I’m using Fedora 21, other distributions use similar package names.

# yum install valgrind kcachegrind graphviz

In order to profile Icinga 2 with all debug symbols included, I’m compiling Icinga 2 with debug symbols enabled: -DCMAKE_BUILD_TYPE=Debug (Note: Using Icinga 2 packages you’ll get a separate package).
Valgrind requires a bunch of parameters which are easier being modified in a small script. I’m also running the direct debug build binaries instead of the installed binary here. Generating some sort of huge debug config inside the Icinga 2 cluster and node inventory is left to the reader’s imagination 😉 (I’ll write a different blog post for that sooner or later).

# vim callgrind_icinga2
#!/bin/bash
valgrind \
-v \
--trace-children=yes \
--tool=callgrind \
--simulate-cache=yes \
--collect-jumps=yes \
--dump-instr=yes \
--dump-line=yes \
/home/michi/coding/icinga/icinga2/debug/Bin/Debug/icinga2 node update-config
# sudo ./callgrind_icinga2

If you want to enforce a manual dump before the program ends, you can invoke the following command:

# callgrind_control -d


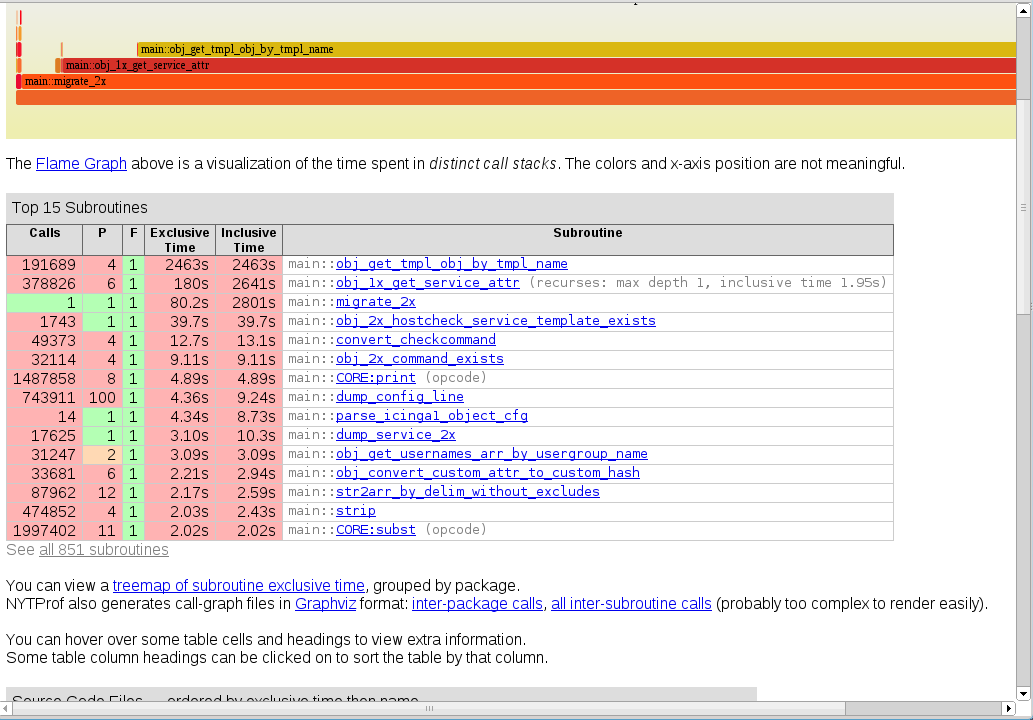
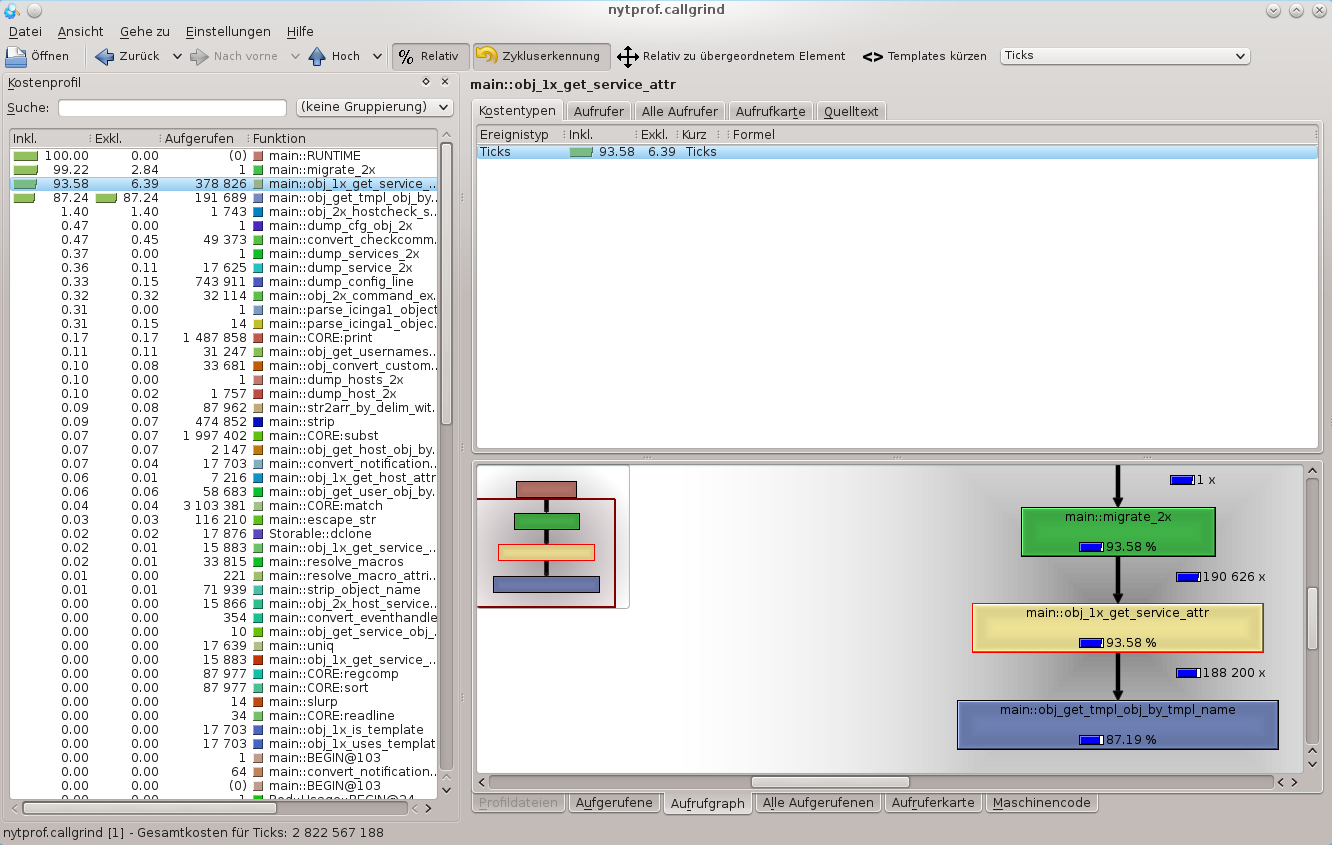
Visualize and analyze the bottlenecks

Opening the callgrind.out file(s)

$ sudo kcachegrind callgrind.out.16903

unveiled that there were certain unnecessary calls to generic functions.

  • Getting objects/changes on each AddObject() call is useless
  • ’node update-config‘ would cause AddObject() to validate each object. But we know already we’re right not parsing user’s input from the cli arguments.

Solve the problem

Refactoring the code and allowing to pass one-time collected objects/changes as well as suppressing configuration validation solved the problem in the end. Still it unveiled that you should sometimes stop feature development and profile your own application 🙂

Perl Profiling mit NYTProf

Nachdem sich meine Kollegen bereits eingehend mit PHP Profiling mit KCacheGrind und XDebug sowie GPerfTools am Beispiel von Icinga 2 beschäftigt haben, möchte ich mich heute dem Perl Profiler NYTProf widmen. Profiling von Perl Scripts ist vor allem dann interessant, wenn man eigene Funktionsaufrufe gekapselt hat, und natürlich, um zu erkennen, womit man aktuell am meisten Zeit verbrät, um daraus Optimierungsstrategien zu entwickeln. Vielleicht gibt es ja auch eine besser Library, um Objekte von der Platte in einen Hash einzulesen, oder schnellere Stringoperationen? Oder auch nur das Übliche – alles ist zu langsam, und man möchte gezielt wissen, wer oder was schuld daran ist 😉
Die Installation ist trivial, wahlweise aus Paketen (EL6 benötigt das Repoforge Repository), oder direkt aus CPAN.

# apt-get install libdevel-nytprof-perl
# yum install perl-Devel-NYTProf
# zypper in perl-Devel-NYTProf
# perl -MCPAN -e 'install Devel::NYTProf'

Den Profiler bindet man wie folgt ein

# perl -d:NYTProf my_perl_script.pl

Standardmässig legt NYTProf im aktuellen Verzeichnis eine Datei namens nytprof.out an (falls Prozesse geforkt werden, mit PID als Suffix. Mittels nytprofmerge können mehrere Dateien wieder zusammengefügt werden). Das kann bei längerer Laufzeit schonmal mehrere hundert Megabyte ausspucken, dementsprechend sollte mans auf einem schnellen Device mit viel Platz ausführen.
Nachdem das Perl Script erfolgreich beendet wurde, kann man das Ergebnis mit unterschiedlichen Exportmechanismen visualisieren.
Die schnellste Methode hierbei ist eine generierte HTML Übersicht inkl Flamegraph, Treemap und Übersichtstabellen mit den am meisten aufgerufensten/längsten dauernden Funktionen. nytprofhtml erwartet sich ohne Angabe von –file als Parameter im aktuellen Verzeichnis die vorher erstelle nytprof.out Datei.

$ nytprofhtml
$ chromium nytprof/index.html

NYTProf HTML Output
Alternativ dazu bietet NYTProf seit Version 3 an, die Profiling Datei in ein Callgrind-lesbares Format zu exportieren. Damit ist es möglich, in gewohnter Umgebung mit KCacheGrind zu arbeiten.

$ nytprofcg
$ kcachegrind nytprof.callgrind

Nytprof Callgrind Kcachegrind
Sofern wider Erwarten mal Performanceprobleme auftreten – wir wissen Bescheid, wie man die Ergebnisse interpretiert und die Performance optimiert, fragt uns einfach 🙂

Profiling mit gperftools

Eines der bekanntesten Profiling-Tools unter Linux ist wohl Valgrind. Valgrind instrumentiert die zu profilende Anwendung und kann so jeden einzelnen Funktionsaufruf nachverfolgen. Allerdings läuft die Anwendung dadurch um ein Vielfaches langsamer ab, als wenn sie ohne Profiling gestartet wird.
Abhilfe schaffen hier Sample-basierte Profiler wie z.B. gperftools. Anstatt jeden Funktionsaufruf mittels Instrumentierung „aufzunehmen“, erstellt gperftools in regulären Intervallen Stack-Snapshots der einzelnen Threads und erkennt so, welche Funktionen häufig aufgerufen werden.
Unter Debian kann gperftools per Paketmanager installiert werden:

# aptitude install google-perftools

Über die Environment-Variable CPUPROFILE können wir angeben, wo gperftools seine Profile-Dateien erstellen soll. Mit LD_PROFILE linken wir den Profiler zur Laufzeit in unser Programm:

$ CPUPROFILE=/tmp/profile LD_PRELOAD=/usr/lib/libprofiler.so ./bin/icinga2 -c ../master.conf

Mit google-pprof kann anschließend die Profile-Datei angezeigt werden:

$ google-pprof ./bin/icinga2 /tmp/profile

JavaScript Memory Leaks mit Chrome lokalisieren

JavaScript ist ja bekanntlich eine Sprache, die ihre Speicherverwaltung an einen Garbage Collector übergibt und dem Programmierer hier ein weitgehend unbeschwertes Leben verschafft. Meistens.
Wer bereits in anderen GC-basierten Laufzeitumgebungen wie Java programmiert hat, der weiß sicher dass auch ein Garbage Collector Memory Leaks in manchen Fällen nicht verhindern kann wenn der Programmierer unachtsam ist. Sobald ein Objekt nämlich noch in einem aktiven Bereich referenziert wird, bleibt er bis zum entfernen dieser Referenz im Heap (immerhin besteht die Möglichkeit, dass man das Objekt noch verwendet). Das Gute: Die meisten Memory Leaks sind so unbedeutend, dass man sie getrost ignorieren kann. Kritisch wird es erst, wenn man viele größere Objekte (z.B. DOM Knoten) über einen langen Zeitraum erstellt und entfernt, auf die aber noch in irgendwelchen Codeecken verwiesen wird (z.B. in einem Array). Dann gibt es auch in JavaScript irgendwann eine OutOfMemoryException – und ohne die richtigen Tools ist deren Ursache schwer aufzufinden (immerhin kann der Bereich z.b. in einem Closure liegen).
mehr lesen…

Memory-Profiling mit Massif

Mit dem Heap-Profiler Massif kann man schnell herauszufinden, welcher Teil eines Programms am meisten Arbeitsspeicher verbraucht. Massif ist Teil von Valgrind und kann unter Ubuntu z.B. so installiert werden:

$ sudo aptitude install valgrind

Danach kann man das zu profilende Programm mit Massif starten:

$ valgrind --tool=massif ./pfad/zum/eigenen/programm --parameter

Massif schreibt die Profiling-Ergebnis in eine Datei mit dem Namen massif.out.<PID>. Wer das ganze etwas grafischer haben möchte, kann den Massif Visualizer verwenden (Paket: massif-visualizer):