Seite wählen

NETWAYS Blog

Monitoring – it’s all about integration and automation – OSMC 2017 Hackathon

OSMC 2017
Also this year we organized a hackathon as follow up and managed to get about 50 people to work on actual coding. We started again with a small round of introduction so everyone had the chance to find people with same interests or knowledge needed. Afterwards people started to hack on Icinga 2, Icinga Web 2, different Modules, OpenNMS, Zabbix, Mgmt, NSClient++, Docker containers, Ansible and Puppet code or simply help others with configuration and other tasks to solve in their environment.
Here is a list of some things developed or at least designed today:
* Tom accepted and improved some of my pull requests, so the director got more property modifiers
* He also was working on improving notifications to allow managing them via a custom attribute of hosts and services
* Markus was improving Icinga packaging resulting in new package releases for SLES and support for Fedora 27
* Bodo was trying to move the ruby library for Icinga 2 to 1.0.0 release and got valuable input by Gunnar for displaying API coverage
* Thomas improved his diagnostics script for Icinga 2 to help with troubleshooting
* Nicola was working on a graphical picker for the geolocation in the Director for his awesome map module while getting several other ideas and requests
* David started a Single Sign On module for Icinga Web 2
* Mgmt got some improvements by Julien, Toshaan und James
* Michael was working on Elastic integration and web based installer for NSClient++
* Gunnar and Michael discussed so many features they actual did not find time for hacking, but keep our eyes open for Elastic 6 support and datatypes for arguments
* Steffen, Blerim and Michael discussed how to fix a problem with running two Icingabeat instances which now could probably be solved
* Stephan finally solved the management issue of red alerts in Icinga Web 2 😉


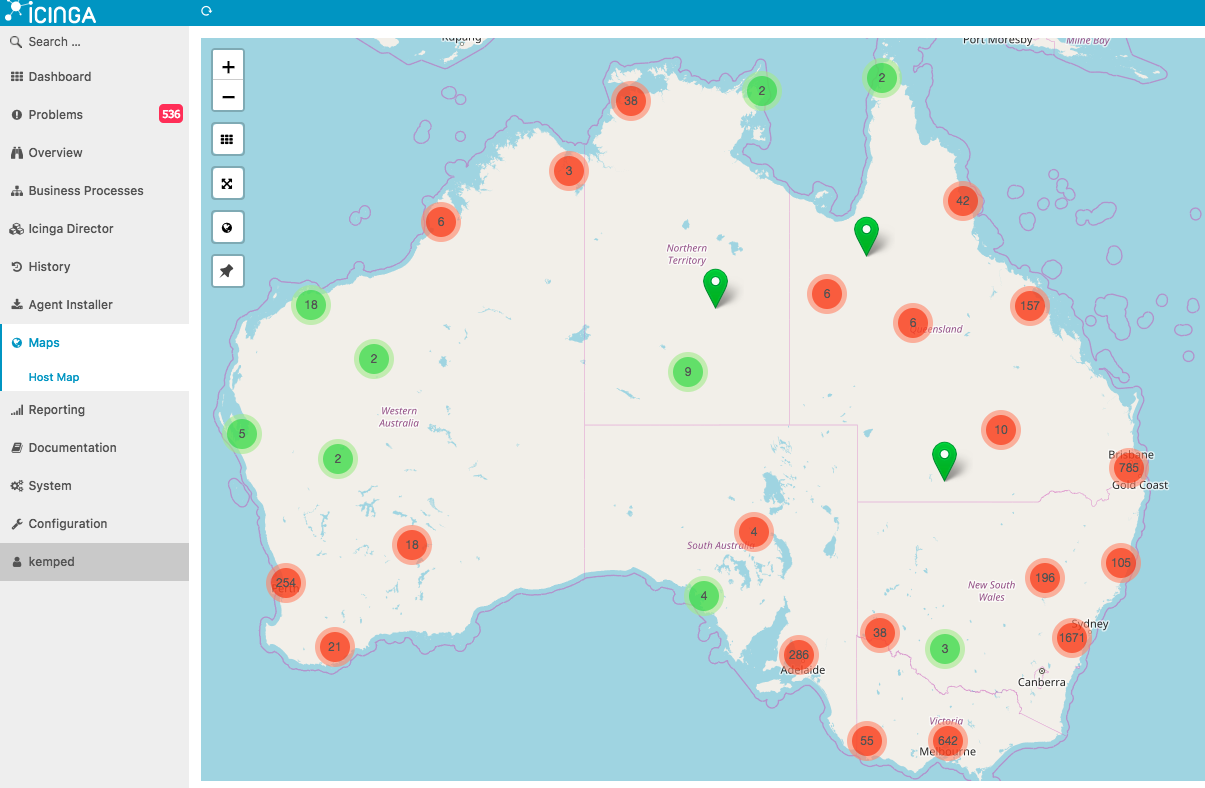
Furthermore an impressive amount of knowledge was transferred, user questions got answered and problems got solved. One thing I am really happy about seeing one user to use the URL encode property modifier only minutes after being accept by Tom to create Hostgroups including membership assignment from PuppetDB. But I want to end this blogpost with one really cool thing Dave from the Australian Icinga Partner Sol1 showed us. This map displays all pubs in Australia because it monitors Satellite receivers to visualize any large outages for Sky Racing Australia.
Map of Australian Pubs by Sol1
So have a nice weekend and keep on hacking.

Dirk Götz
Dirk Götz
Principal Consultant

Dirk ist Red Hat Spezialist und arbeitet bei NETWAYS im Bereich Consulting für Icinga, Puppet, Ansible, Foreman und andere Systems-Management-Lösungen. Früher war er bei einem Träger der gesetzlichen Rentenversicherung als Senior Administrator beschäftigt und auch für die Ausbildung der Azubis verantwortlich wie nun bei NETWAYS.

Monitoring – it’s all about integration and automation – OSMC 2017 Day 2

OSMC 2017
The second day started with „Monitoring – dos and don’ts“ presented by Markus Thiel. Room was already full on the first talk what was not expected when people move from evening event to late lounge and then at 5 o’clock in the morning to the hotel. Event was great great with good food, drinks and chat. But Julia already wrote about that so I will focus on the talks and Markus one was nicely showing „don’ts“ I also recognize from my daily work as consultant and helped with tips how to avoid them. He got deeply into details so I can not repeat everything, but just to summarize the biggest problem is always communication between people or systems, perhaps you already knew this from your daily business.
The second talk I attended was Bodo Schulz talking about automated and distributed monitoring of a continuous integration platform. He created his own service discovery named Brain which discovers services and put them into Redis which is then read by Icinga 2 and Grafana for creating configuration. Pinky is his simple stack for visualisation consisting of containers. Both of them are integrated in the platform, one Brain for every pipeline, one Pinky for every team. If you did not get the reference. watch the intro on youtube. His workarounds for features he missed were also quite interesting like implementing his own certificate signing service for Icinga 2 or displaying License data in Grafana. And of course he had a live demo to show all this fancy stuff which was great to see.
Tom was giving the third talk of the day about automated monitoring in heterogeneous environments showing real life scenarios using the Director’s capabilities. He started with the basics explaining how import, synchronization and jobs work and followed by importing from an old Icinga environment utilizing SQL and the IDO database. In the typical scenario for importing from a CMDB Tom showed typical problems like bad quality of input data and how to workaround with the Director to get a good quality of output. Another scenario explained how to get data from Active Directory for the Windows part of your environment. For VMware users he show the already released vSphere module and also the prototype of the vSphereDB module which adds some more visualization and for AWS users the corresponding module. And the last one showed how to import Excel files using the Fileshipper. And of course he explained how easy it is to create your own import source.
Right after the excellent lunch and the even better event massage Marianne Spiller’s talk „Ich sehe was, was du nicht siehst (… und das ist CRITICAL!)“ (in English „I spy with my little eye something CRITICAL!“) focused on how to get a good monitoring environment with a high user acceptance up and running. Being realistic and show everyone his benefits are the best tips she gave but also she could not provide the one solution that fits all. For more of her tips ranging from technical to organizational I can recommend her blog.
Lennart and Janina Tritschler were talking about distributed Icinga 2 environments automated by Puppet. Really happy to see the talk because Janina adopted Icinga 2 after a fundamentals training I gave about a year ago. They started with a basic introduction of distributed monitoring with Icinga 2 as master, satellite and agent and configuration management with Puppet including exported resources. Afterwards they were diving deeper into the Puppet module for Icinga 2 and how to use it for installation and configuration of the environment. In their demos they included several virtual machines to show how easily this can be done.
In the last break the winner of the gambling at the evening event got his price, a retro game console.
Last but not least I decided for Kevin Honka’s talk „Icinga 2 + Director, flexible Thresholds with Ansible“ in favor of Thomas talking about troubleshooting Icinga2. But I am sure his talk was great as troubleshooting is his daily business as our Lead Support Engineer. Kevin was unhappy with static threshold configured in their Monitoring environment so started to develop a python script to include in his Ansible workflow which modifies thresholds using the Director API. On his roadmap is extending it by creating a Icinga 2 python library usable for others, utilizing this library in a real Ansible module and extending functionality.
Thanks to all speakers, attendees and sponsors leaving today for the great conference, save travels and see you next year on November 5th – 8th for the next OSMC. And of course a nice dinner and happy hacking to all staying for the hackathon tomorrow, I will keep our readers informed on the crazy things we manage to build.

Dirk Götz
Dirk Götz
Principal Consultant

Dirk ist Red Hat Spezialist und arbeitet bei NETWAYS im Bereich Consulting für Icinga, Puppet, Ansible, Foreman und andere Systems-Management-Lösungen. Früher war er bei einem Träger der gesetzlichen Rentenversicherung als Senior Administrator beschäftigt und auch für die Ausbildung der Azubis verantwortlich wie nun bei NETWAYS.

Monitoring – it's all about integration and automation – OSMC 2017 Day 1

OSMC 2017
Also for the 12th OSMC we started on Tuesday with a couple of workshops on Icinga, Ansible, Graphing and Elastic which were famous as always and afterwards with meet and greet at the evening dinner. But the real start was as always a warm Welcome from Bernd introducing all the small changes we had this year like having so many great talks we did three in parallel on the first day. Also we had the first time more English talks than German and are getting more international from year to year which is also the reason for me blogging in English.
The first talk of the day I attended was James Shubin talking about „Next Generation Config Mgmt: Monitoring“ as he is a great entertainer and mgmt is a really a great tool. Mgmt is primarily a configuration management solution but James managed in his demos to build a bridge to monitoring as mgmt is event driven and very fast. So for example he showed mgmt creating files deleted faster then a user could recognize they are gone. Another demo of mgmt’s reactivity was visualizing the noise in the room, perhaps not the most practical one but showing what you can do with flexible inputs and outputs. In his hysteresis demo he showed mgmt monitoring systemload and scale up and down the number of virtual machines depending on it. James is as always looking for people who join the project and help hacking, so have a look at mgmt (or the recording of one of his talks) and perhaps join what could really be the next generation of configuration management.
Second one was Alba Ferri Fitó talking about community helping her doing monitoring at Vodafone in her talk „With a little help from…the community“. She was showing several use cases e.g. VMware monitoring she changed from passive collection of snmptraps to proactively monitoring the infrastructure with check_vmware_esx. Also she helped to integrate monitoring in the provisioning process with vRealise using the Icinga 2 API, did a corporate theme to get a better acceptance, implemented log monitoring using the sticky option from check_logfiles, created her own scripts to monitor things she was told they could only be monitored by SCOM or using expect for things only having an interactive „API“. It was a great talk sharing knowledge and crediting community for all the code and help.
Carsten Köbke and our Michael were telling „Ops and dev stories: Integrate everything into your monitoring stack“. So Carsten as the developer of the Icinga Web 2 module for Grafana started the talk about his motivation behind and experience gained by developing this module. Afterwards Michael was showing more integration like the Map module placing hosts on an Openstreet map, dashboards, ticket systems, log and event management solutions like Greylog and Elastic including the Icingabeat and an very early prototype (created on the day before) for a module for Graylog.
After lunch which was great as always I attended „Icinga 2 Multi Zone HA Setup using Ansible“ by Toshaan Bharvani. He is a self-employed consultant with a history in monitoring starting with Nagios, using Icinga and Shinken for a while and now utilizing Icinga 2 to monitor his costumer’s environments. His ansible playbooks and roles showed a good practical example for how to get such a distributed setup up and running and he also managed to explain it in a way also people not using Ansible at all could understand it.
Afterwards Tobias Kempf as the monitoring admin and Michael Kraus as the consultant supporting him talked about a highly automated monitoring for Europe’s biggest logistic company. They used omd to build a multilevel distributed monitoring environment which uses centralized configuration managed with a custom webinterface, coshsh as configuration generator and git, load distribution with mod_gearman and patch management with Ansible.
Same last talk like every year Bernd (representing the Icinga Team) showed the „Current State of Icinga“. Bernd shortly introduced the project and team members before showing some case studies like Icinga being deployed on the International Space Station. He also promoted the Icinga Camps and our effort to help people to run more Icinga Meetups. Afterwards he started to dive into technical stuff like the new incarnation of Icinga Exchange including full Github sync, the documentation and package repository including numbers of downloads which were a crazy 50000 downloads just for CentOS on one day. Diving even deeper into Icinga itself he showed the new CA Proxy feature allowing multilevel certificate signing and automatic renewal which was sponsored by Volkswagen like some others, too. Some explanation on projects effort on Configuration management and which API to use in the Icinga 2 environment for different use cases followed before hitting the topic logging. For logging Icinga project now provides output for Logstash and Elasticsearch in Icinga 2, the Icingabeat, the Logstash output which could create monitoring objects in Icinga 2 on the fly and last but not least the Elasticsearch module for Icinga Web 2. In his demos he also showed the new improved Icinga Web 2 which adds even more eye candy. Speaking about eye candy also the latest version of Graphite module which will get released soon looks quite nice. Another release pending will be the Icinga Graphite installer using Ansible and Packaging to provide an easy way to setup Graphite. So keep an eye on release blogposts coming next weeks.
It is nice to see topics shift through the years. While the topics automation and integration were quite present in the last years it was main focus of many talks this year. This nicely fits my opinion that you as a software developer should care about APIs to allow easy integration and as an administrator you should provide a single interface I sometimes call „single point of administration“.
Colleagues have collected some pictures for you, if you want to see more follow us or #osmc on Twitter. So enjoy these while I will enjoy the evening event and be back tomorrow to keep you updated on the talks of second day.

Dirk Götz
Dirk Götz
Principal Consultant

Dirk ist Red Hat Spezialist und arbeitet bei NETWAYS im Bereich Consulting für Icinga, Puppet, Ansible, Foreman und andere Systems-Management-Lösungen. Früher war er bei einem Träger der gesetzlichen Rentenversicherung als Senior Administrator beschäftigt und auch für die Ausbildung der Azubis verantwortlich wie nun bei NETWAYS.

Versteckte Perlen in Icinga Web 2

In Icinga Web 2 gibt es ein paar versteckte Parameter, die leider noch nicht dokumentiert sind aber sicher hier und da hilfreich sein können.
Entwicklermodus für JavaScript und CSS
Icinga Web 2 liefert eigentlich JavaScript und CSS komprimiert an den Client aus. Als Entwickler oder zur Fehlersuche ist aber hilfreich, die Kandidaten in ihrer Originalform auszuliefern. Dazu hängt man den Parameter _dev=1 an die URL.
Listen und Detail-Informationen exportieren
Die Listen zur Ansicht der Hosts, Services und Gruppen und der jeweiligen Detail-Bereiche lassen sich nach JSON und CSV exportieren. Dazu hängt man den format Parameter mit entweder json oder csv als Wert an, also z.B. icingaweb2/monitoring/list/services?format=json.

Vollbildmodus
Um eine Sicht in Icinga Web 2 in den Vollbildmodus zu bringen, hängt man einfach die zwei Parameter showCompact=1 und showFullscreen=1 an die URL. showCompact blendet die Kontrollelemente wie den Filter-Editor und Paginator aus und showFullscreen das Menü und den Header. Das ganz sieht dann so aus:

Eric Lippmann
Eric Lippmann
CTO

Eric kam während seines ersten Lehrjahres zu NETWAYS und hat seine Ausbildung bereits 2011 sehr erfolgreich abgeschlossen. Seit Beginn arbeitet er in der Softwareentwicklung und dort an den unterschiedlichen NETWAYS Open Source Lösungen, insbesondere inGraph und im Icinga Team an Icinga Web. Darüber hinaus zeichnet er für viele Kundenentwicklungen in der Finanz- und Automobilbranche verantwortlich.

Fully packed to reduce heating – OSMC 2016 – Tag 3

OSMC Logo
Nach zwei interessanten Tagen mit Vorträgen ging es heute zum Abschluss wieder ans gemeinsame Hacken beim Hackathon. In einer kurzen Vorstellungsrunde kristallisierten sich bereits die Themen heraus und es ging sofort ans umgruppieren um den gemeinsamen Interessen zu folgen.
Neben viel Erfahrungsaustausch, migrierten Monitoringumgebungen, internen Skripten rund um Icinga 2, umgebungsspezifischen „Icinga Web 2“-Modulen und Prototypen wie „Icinga 2“-SNMP-MIBs und Debian-Packages für NSClient++, gibt es auch tatsächlich Ergebnisse zu vermelden.
Hackathon
* Das neue Puppet Module für Icinga 2 erhielt Unterstützung für SLES 12 (Pull-Request on Github)
* Die „Icinga 2“-Vagrant-Boxes erhalten Proxy-Support (Pull-Request on Github)
* Der Prototyp eines Elastic-Icinga-Beat (Prototype on Github)
* Das mit Dashing-Icinga2 zur Verfügung gestellte Dashboard wurde um weitere Funktionalitäten erweitert (Commit bereits gemerged)
* Das „Icinga Web 2“-Module NagVis wurde erweitert, unter anderem um Zoom für Dashboards (Commit bereits gemerged)
* Icinga Web 2 kann nun konfiguriert werden um Standalone zu laufen (Patch verfügbar)
* Neben einem kleinen Fix wurde dem Foreman-Smart-Proxy Monitoring-Plugin beigebracht Hosts in Icinga 2 anzulegen (Feature-Branch auf Github)
* Einen adaptiven Http-Check (Repository auf Github)
Ich würde es bei diesem Output als einen erfolgreichen Hackathon bezeichnen!
P.S.: Wer viel auf Github unterwegs ist, dem möchte ich noch den Artikel zum Erstellen eigener Labels ans Herz legen. Der erwähnte Smart-Proxy hat nun farblich korrekte Labels für Icinga 2 und Zabbix.

Dirk Götz
Dirk Götz
Principal Consultant

Dirk ist Red Hat Spezialist und arbeitet bei NETWAYS im Bereich Consulting für Icinga, Puppet, Ansible, Foreman und andere Systems-Management-Lösungen. Früher war er bei einem Träger der gesetzlichen Rentenversicherung als Senior Administrator beschäftigt und auch für die Ausbildung der Azubis verantwortlich wie nun bei NETWAYS.