Windows performance counters have been there for ages. While modern interfaces such as WMI attempt to replace performance counters they still provide access to unique metrics. Fetching performance counters through NSClient++ is helped with the check_pdh query.
We’ve had an interesting issue with performance counters being received from a Windows client and then written to Graphite. The involved components in this setup are
- Icinga 2 as master
- GraphiteWriter feature enabled and Graphite running
- An Icinga 2 client on the windows machine checked via cluster config sync
- “nscp-local” CheckCommand objects for querying nscp.exe directly (config sync, global zone)
- NSClient++ installed on the Windows client
The Problem
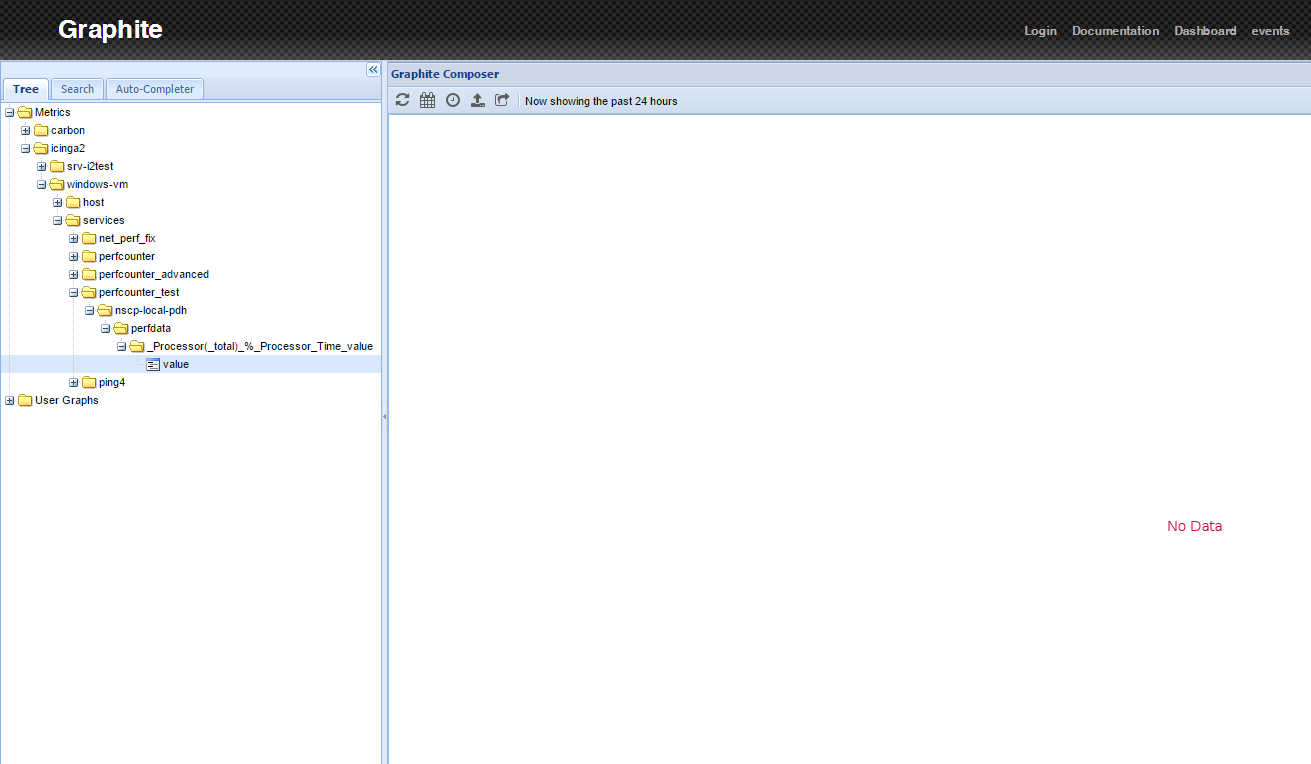 Graphite Web refuses to display any value for that metric as seen in the screenshot. A similar problem is discussed at the monitoring portal (German).
While further analysing the problem we’ve come around this blog post. It did not help resolve the problem but provided insights on the problem within Graphite itself.
The culprit lies in the performance data label containing the “%” character. You will encounter similar issue with the “*” character. The filesystem does not allow to store and load these files.
There’s an issue on the Graphite bug tracker which targets dealing with special characters and better error handling.
The Solution
It may sound reasonable to remove such strings in the Carbon Cache backend, or use a shell wrapper for calling the nscp.exe and reformatting the returned metrics. Though those are just workarounds for the real issue.
 At first glance we looked into perf-config but that only allows to modify the performance data label suffix. The documentation is still a TODO so it was more or less reading the source code and figuring out what other options are available.
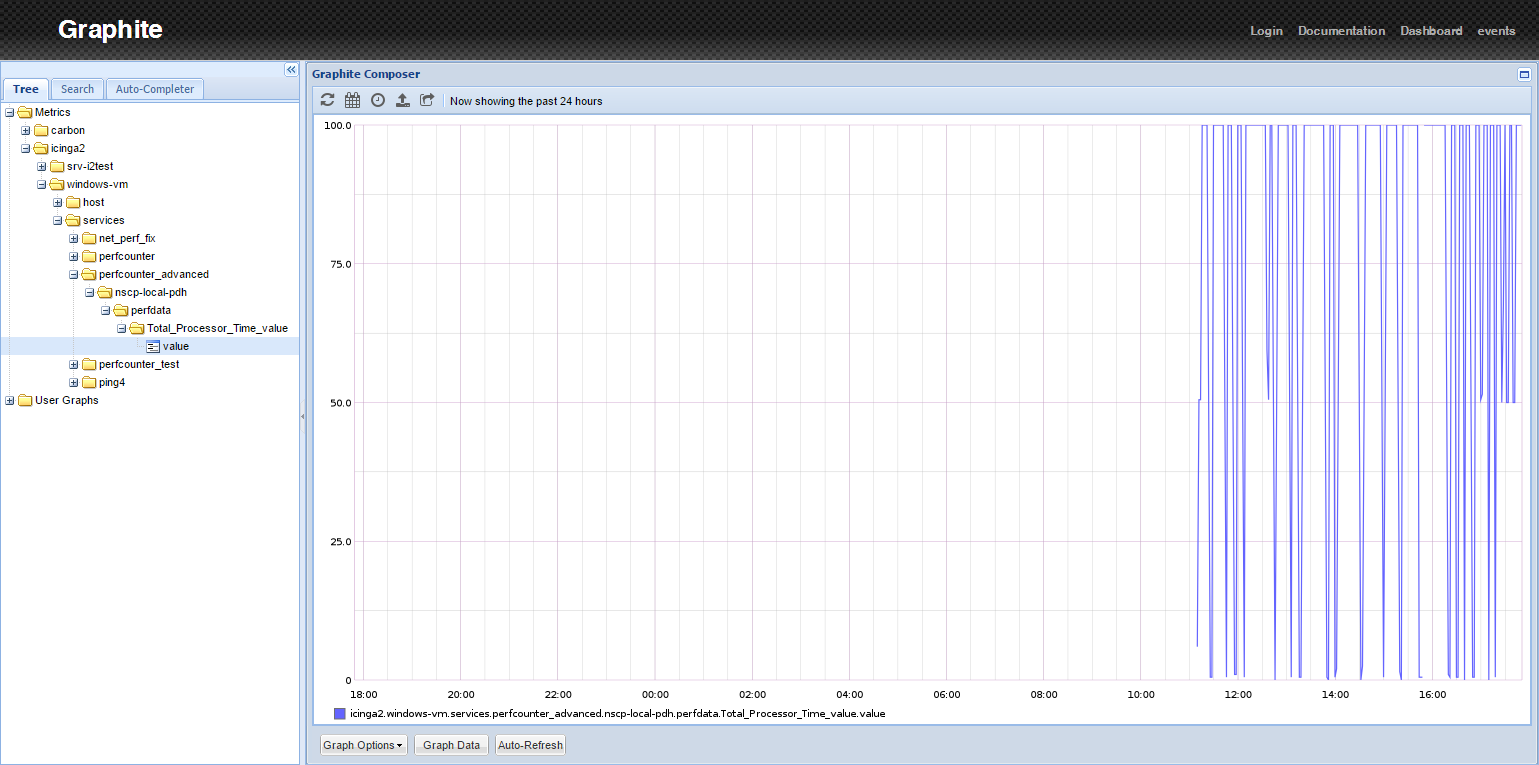
In the end it turned out to be far more easy – Michael Medin, you’re a genius – perf-syntax provides the ability to just format your metrics as plugin performance data for your likings. The following example overrides the counter label to “Processor Time” – Graphite works again!
C:\Program Files (x86)\NSClient++>nscp.exe client --load-all --log info -b -q check_pdh counter="\Processor(_Total)\% Processor Time" perf-syntax="Processor Time"
11:02 OK: \Processor(_Total)\% Processor Time = 0|'Processor Time_value'=0;0;0
Icinga 2 Integration
The nscp-local CheckCommand definitions must be included by editing the icinga2.conf file on both the master and the client.
include <nscp-local>
If you prefer to use your own CheckCommand definition ensure to deploy it using a global zone defined on both the master and the client.
CheckCommand example:
object CheckCommand "nscp-local-pdh" {
        import  "nscp-local"
        arguments += {
            "counter" = {
                value = "counter=$pdh_counter$"
                required = true
                skip_key = true
            }
            crit = {
                value = "crit=value > $pdh_crit$"
                skip_key = true
            }
            warn = {
                value = "warn=value > $pdh_warn$"
                skip_key = true
            }
            "perf-syntax" = {
                 value = "perf-syntax=$pdh_perfsyntax$"
                 skip_key = true
            }
        }
        vars.nscp_query = "check_pdh"
        vars.pdh_perfsyntax = "$pdh_counter$"
}
Service apply example (via cluster config sync):
apply Service "perfcounter_test" {
    import "generic-service"
    check_command = "nscp-local-pdh"
    vars.pdh_counter = "\\Processor(_total)\\% Processor Time"
    vars.pdh_perfsyntax = "Total Processor Time"
    vars.pdh_warn = "1"
    vars.pdh_crit = "5"
    assign where host.address
}
I’ve created an Icinga 2 issue for extending the Icinga 2 NSCP CheckCommands to provide the perf-config and perf-syntax natively.
More Hints
NSClient++ 0.4.2 changed the performance data label for counters and added the “_value” suffix. More recent versions allowed to override the suffix by defining the perf-config attribute. Although there is a bug which does not allow to remove the suffix. This should be fixed in the most recent stable release.
perf-config=*(suffix:none)
Conclusion
A tricky problem which probably affects a lot of users. A benefit of Open Source development – read the source, Luke 🙂

(Copyright by http://blog.codinghorror.com/learn-to-read-the-source-luke/)


0 Kommentare