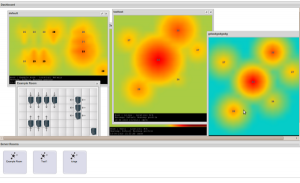
Reflecting on hot summer days in data centers, Jannis revealed Heatmap for Icinga. Now while enjoying ice cream, admins can view their server room and react quickly to temperature problems. With a drag and drop, servers and sensors can be laid out on the map and intervals for temperature processing set. Replete with dashboard, it integrates seamlessly into Icinga Web and is ready for download at netways.org as always.
We paid our respects to JIT (JavaScript InfoVis Toolkit) while Julian shared his presentation slides from LinuxTag in Berlin on Nagios and Icinga. He then went on to bring bad news to Windows 2000 users – as of 13 July 2010, Microsoft will end support for all Windows 2000 regardless of type. This means no free updates or security updates, which may also mean security problems will no longer be fixed. On the same day, normal support for Windows 2003 Server (and Server R2) will run out and only extended support will be provided. So only issues critical to security will be fixed, for all others a patch will be offered only to those in their paid support program. This extended support will be available to 14 July 2015- so it seems now is high time to switch out!
Finally, Bernd introduced his new series to tackle the SOAP or REST question which all developers inevitably face in service oriented development. He plans to look at both architectures in detail and compare their advantages and disadvantages. In the meantime he pointed to a previous post from Julian for a good starting point. Till then, keep your eyes peeled!
NETWAYS Blog
Heatmap for Icinga
Gerade in den heißen Sommermonaten haben es Administratoren nicht leicht: Eigentlich freut man sich ja wenn das Thermometer über 25° steigt, stellt man dann allerdings fest dass das Thermometer im Serverraum steht, vergeht einem das Lachen schnell.
Gerade in kritischen Umgebungen kommen deswegen Temperatursensoren zum Einsatz, um auf etwaige Temperaturprobleme sofort reagieren zu können. Kommt man jedoch in einen Bereich von 20+ Server, fällt es schwer, räumliche Zusammenhänge bei erhöhten Temperaturen zu erkennen – Wer weiß schon immer auf Anhieb, welche Server wo stehen?
Genau dieses Problem haben wir mit unserem Heatmap for Icinga Modul angepackt. Direkt in Icinga-Web Frontend kann man hier ganz einfach Serverräume anlegen, per Drag&Drop seine Server und Sensoren plazieren und 
Das Modul integriert sich durch das Moduleloader System nahtlos in Icinga-Web und demonstriert als erstes Modul für die Weboberfläche, welches Potenzial für Erweiterungen in Icinga stecken.
Herunterladen kann man sich das Paket wie immer hier.


