
In his talk at our Open Source Monitoring Conference OSMC Emil-Andreas Siemes showed how organisations can drastically reduce their MTTR (Mean Time To Repair) by using, integrating and correlating the Open Source tools Mimir, Loki & Tempo. He also talked about Open Source reliability testing to even avoid problems in the first place. And yes, with the use of Grafana. The moment Emil asked the crowd who uses Grafana, and I looked around, almost every single hand in the entire conference room was up.
Essentials on the Grafana Stack
Today Grafana labs employs over 1000 employees, improving observability. The core projects to pull this off are:
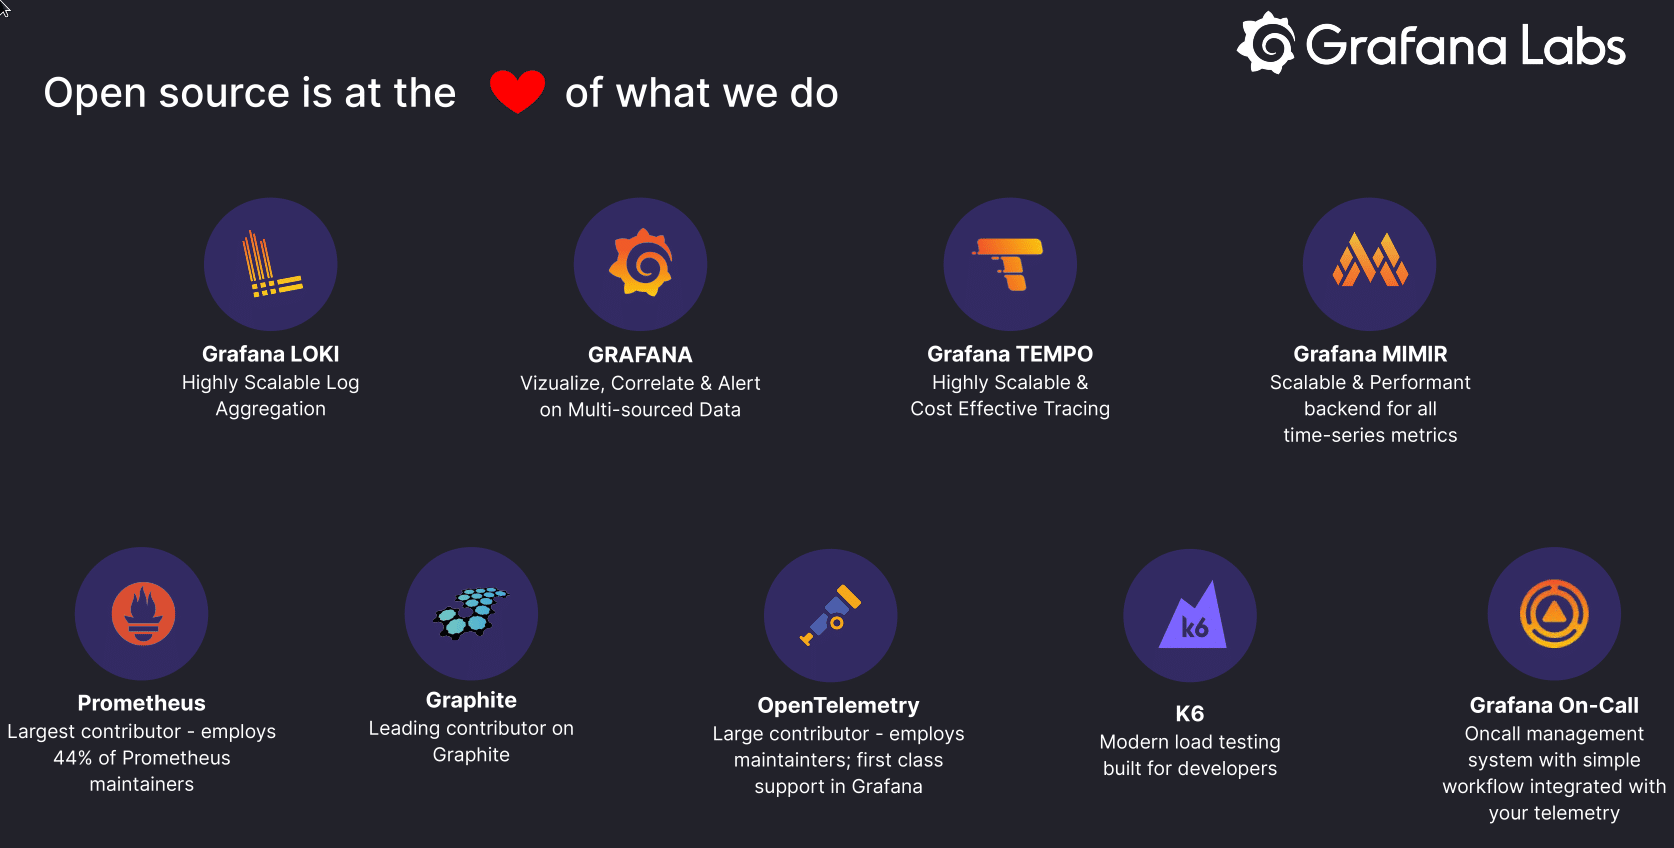
The Grafana Stack is also known as LGTM: Loki for logs, Grafana for visualization, Tempo for traces, and Mimir for metrics. In addition they employ 44 % of Prometheus maintainers, and provide the Grafana Mimir long term storage.
Grafana Faro
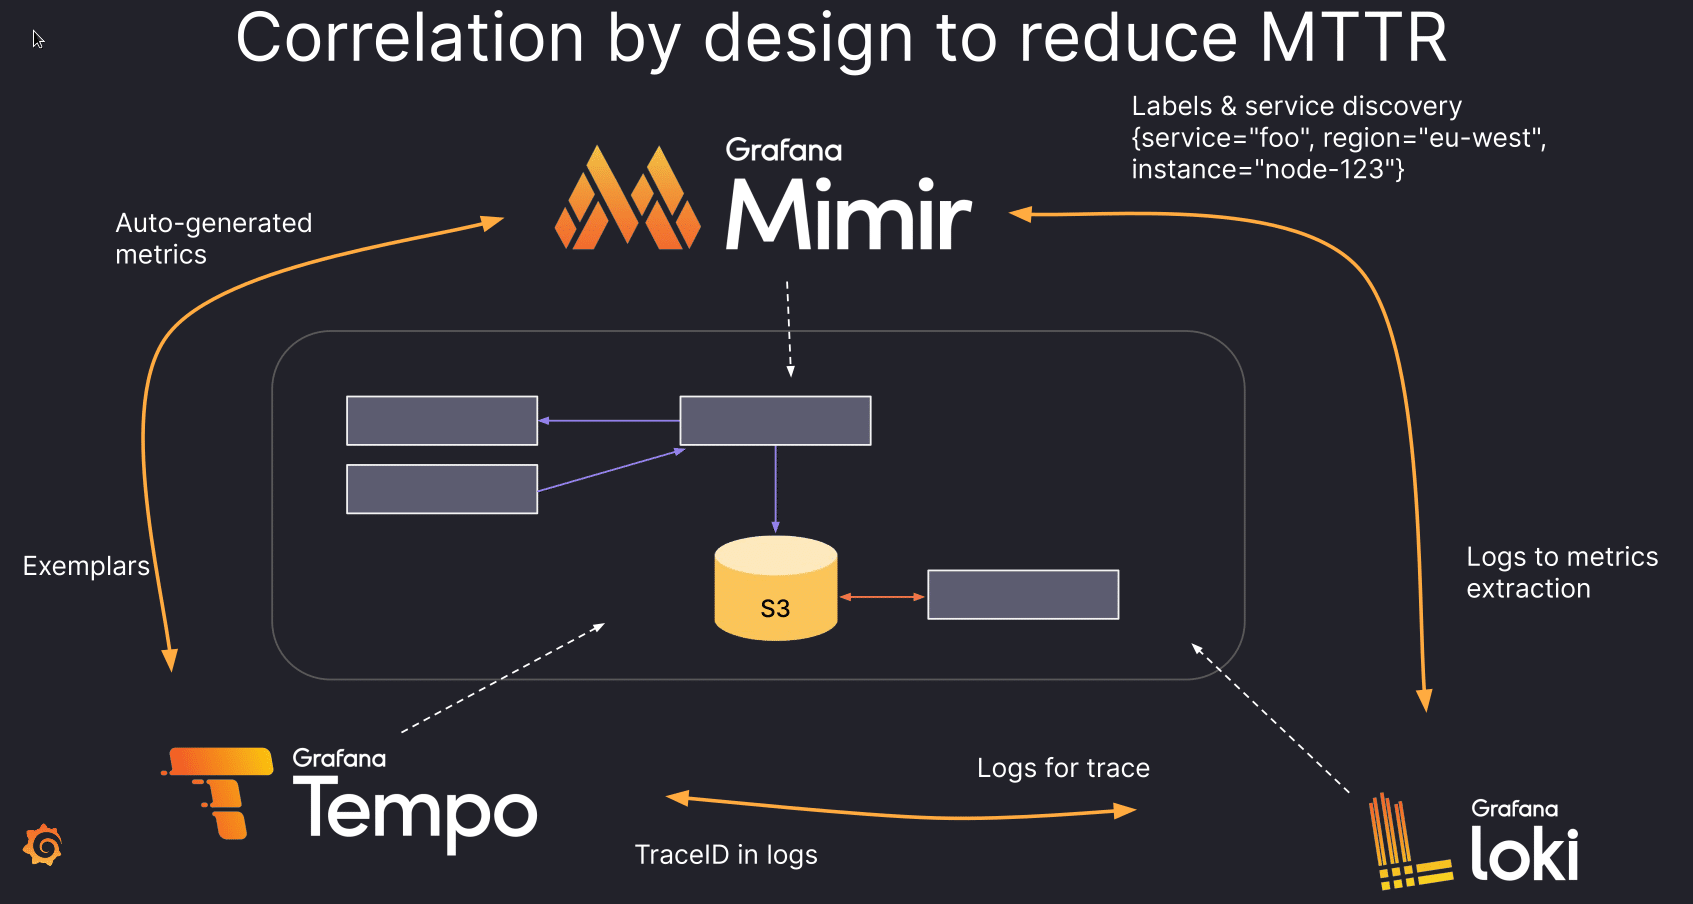
Emil emphasized the importance of OpenTelemetry which a standard for traces, metrics and logs (including metadata) and the way Tempo (traces) and Loki (log ingestion & aggregation) work together with Mimir. Another important point of the talk was a new way how Grafana Faro, an Open Source web SDK is able to provide frontend application observability!
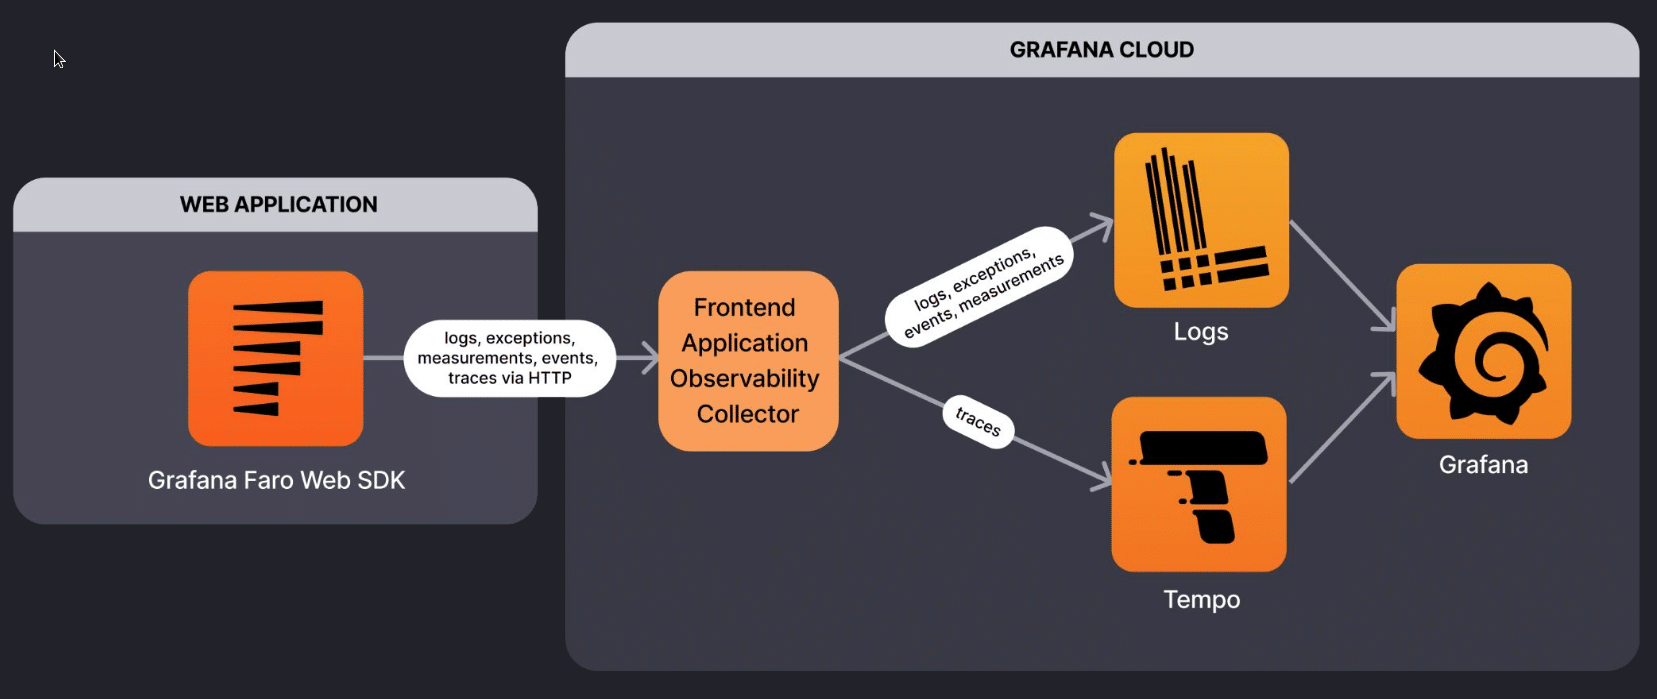
Emil showed a Faro demo, and webvitals such as TTFB, FCP, CLS, LCP, FID were able to be picked up. This might be something very interesting for web and app developers in the future to improve and monitor their applications.
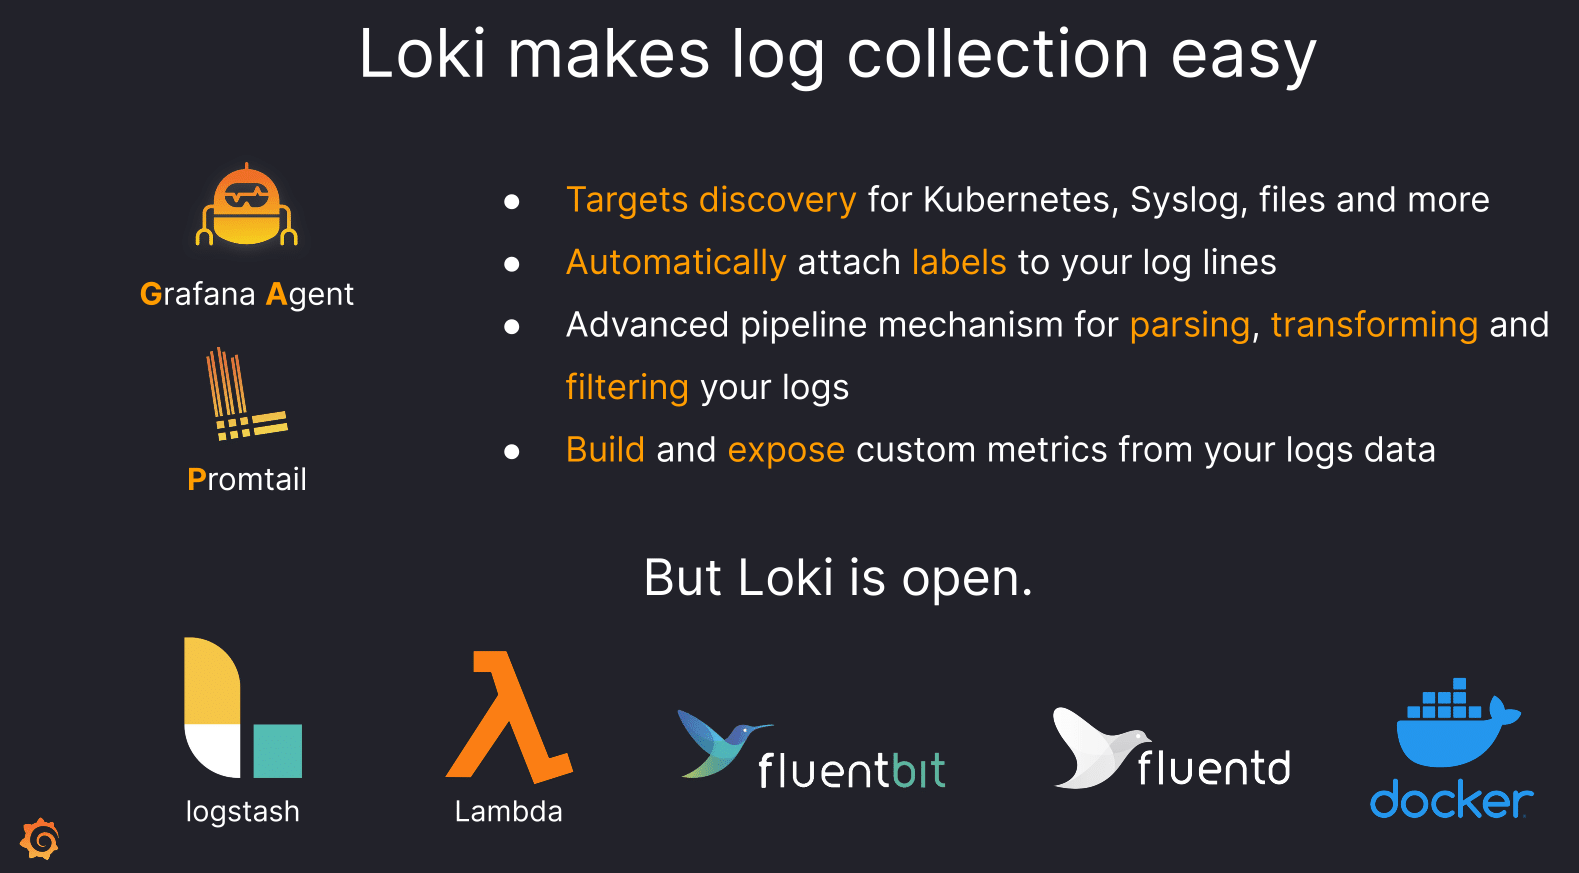
Improvements to Loki
Finally Emil discussed improvements to Loki, whose performance was significantly improved by 4x faster queries, and 50% less CPU power. Then LogQL was discussed and examples for Log & Metrics queries were shown, which should be quickly picked up by those familiar with PromQL.
Helping you get more observability
Overall the talk was a great way to get introduced and updated on the Grafana ecosystem. In case you need help to provide visibility and scaling to your ecosystem, at NETWAYS we provide consulting for integrating Grafana into your infrastructure. Feel free to contact us, and see you at the next event!
The recording and slides of this talk and all other OSMC talks can be found in our Archives. Check it out! We hope to see you around at OSMC 2023! Stay in touch and subscribe to our Newsletter!


0 Comments