
At the last OSMC we had the honour of welcoming Dave McAllister from America. Dave McAllister works at NGINX in America and has been working in the world of observability and monitoring for a long time.
Although he works at NGINX, his talk was not about NGINX as you might expect. Rather, he gave us an insight into data and how to process and read it.
When you are in the observability space, you are usually overwhelmed by a lot of data. In order to get meaningful results from this amount of data, it needs to be processed (maybe even sampled) and we need to understand what this data is telling us before we process it.
So, How is Data Processed?
Much of the data is aggregated using the average. But even here there are different methods.
Most statistics are based on the mean, median, or mode. But what is it?
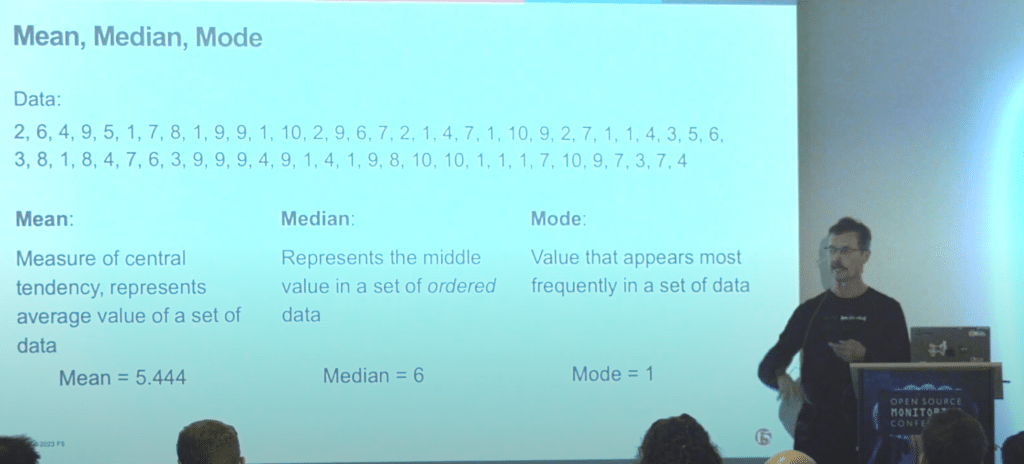
The ‘mean’ is the actual average of a set of values. For a data set of ‘1,5,8,7,1’, the mean would be 4.4. This is calculated by adding the data points and dividing by the set. In our example, (1+5+8+7+1)/5 = 4.4. The ‘median’ is the value in the middle of a set of data in an ordered sequence. In our example, it would be 5 (1,1,5,7,8).
The ‘mode’ is not calculated using a formula (unlike the previous ones), otherwise it is formed from the most common value. In our example this would be the number 1. 1 occurs twice in our set, while all other points are unique.
You can see from the above examples how important it is to know how to treat your data. The “wrong” use of algorithms can lead to undesirable results. It is therefore important to know what you want to determine before aggregating the data.
Data Sampling
As a monitoring and observability engineer, you are usually overwhelmed by the amount of data that needs to be managed, aggregated and processed. Dave McAllister talks about a customer he visited who was dealing with 42TB of data per hour. No one can handle that amount of data.
As the amount of data increases, so does the difficulty of analysing it. Sampling provides a solution to this problem. In sampling, large amounts of data are converted into smaller amounts of data, or collected in a sampled fashion.
As you can imagine, there are many different ways of doing sampling. The basic ones are ‘head-based’ and ‘tail-based’.
With head-based, a decision is made before a trace is collected whether or not to keep it. This cannot affect the validity of the data, as both good and bad traces are collected.
Tail-based sampling is the exact opposite. With tail-based sampling, you let a trace finish first and then decide whether to keep it or not. In this respect, it is more like “filtering” the data than random sampling.
Calculate probabilities
In addition to the important aspects of aggregation and sampling, Dave McAllister also gave us an insight into the calculation of probabilities.
If you have a large amount of meaningful data, you can use it to predict probabilities.
A classic example from IT is predicting whether a hard drive will fail within a certain period of time.
Again, there are different ways of making predictions. Dave’s talk gives us a small but nice and detailed insight into stochastics.
The “Weibull” method can be used to predict when a hard drive is likely to fail. Weibull is mainly used to calculate “time to failure”. Another method is “exponential”. This can be used to calculate the time between two events.
These two methods are just a small glimpse into stochastics.
Summary
As you have seen from the few examples in this blog post, statistics are the way to analyse data.
With the correct use of data, good and meaningful statistics and even predictions / probabilities can be calculated and only very few principles are used in most decisions, so everyone can use them.
By now you should have realized how important it is to use data correctly and what is possible with it.
If you want an even deeper and more detailed insight into the topic, I can only recommend the video of Dave McAllister’s talk.


0 Comments