In a previous post, Sebastian explained how to monitor your Kubernetes cluster with the Prometheus Operator. This post builds on that and shows how to set up notifications via email and as push notifications with the Alert Manager.
Install the Monitoring Stack with Helm
In addition to the method shown by Sebastian for deploying the Prometheus operator, there is another variant that can be used to set up a complete Prometheus stack in the Kubernetes cluster. This is done with the help of the package manager Helm. The sources of the Helm Chart for the Prometheus stack can be found on Github. There you will also find a file containing all configuration options and default values of the monitoring stack. Besides the Prometheus operator and Grafana, the Prometheus Node Exporter, Kube State Metrics and the Alert manager are also part of the stack.
New at this point is Kube State Metrics and the alert manager. Kube State Metrics binds to the Kubernetes API and can therefore retrieve metrics about all resources in the cluster. The alert manager can alert based on a set of rules for selected metrics. In the Helm setup, each component can be configured via the options in the values file. It makes sense to use a PVC for both Prometheus and Alert manager and therefore to have the metrics and history of alarms as well as the alarm suppressions persistent.
In my case, a Persistent Volume Claim (PVC) is created for both with the following values. The name of the storage class can of course vary.
alertmanager:
  alertmanagerSpec:
    storage:
      volumeClaimTemplate:
        spec:
          storageClassName: nws-storage
          accessModes: ["ReadWriteOnce"]
          resources:
            requests:
              storage: 10Gi
prometheus:
  prometheusSpec:
    storageSpec:
      volumeClaimTemplate:
        spec:
          storageClassName: nws-storage
          accessModes: ["ReadWriteOnce"]
          resources:
            requests:
              storage: 10Gi
I will save the configuration in the directoryprom-config as a file stack.values. Now you can deploy the stack.
First you have to integrate the appropriate repos:
helm repo add prometheus-community https://prometheus-community.github.io/helm-charts
helm repo update
The stack is then created:
helm install nws-prometheus-stack prometheus-community/kube-prometheus-stack -f prom-config/stack.values
Using port forwarding, you can call the Grafana web interface via browser and log in with the credentials admin/prom-operator.
kubectl port-forward service/nws-prometheus-stack-grafana 3002:80
Then open http://localhost:3002/ in the browser.
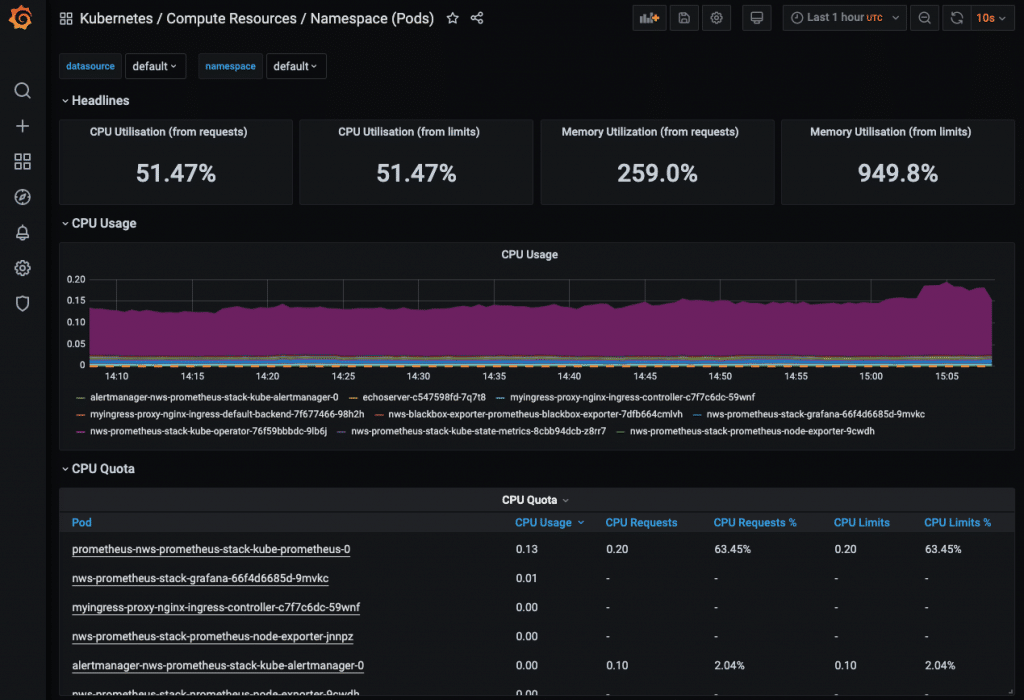
Some predefined dashboards are already included. However, in order to display metrics for all dashboards (scheduler, Etcd, etc.), further options have to be set in the values of Prometheus. In this post, however, I will not go into how these can be configured. Instead, as I mentioned at the beginning, I would like to demonstrate how to set up alarms. This is where the alert manager comes into play. In Grafana, however, you look for it in vain. A look at the Prometheus Web UI makes more sense. So first set up a port forward for it again:
kubectl port-forward service/nws-prometheus-stack-kube-prometheus 3003:9090
Then open http://localhost:3003/ in the browser.
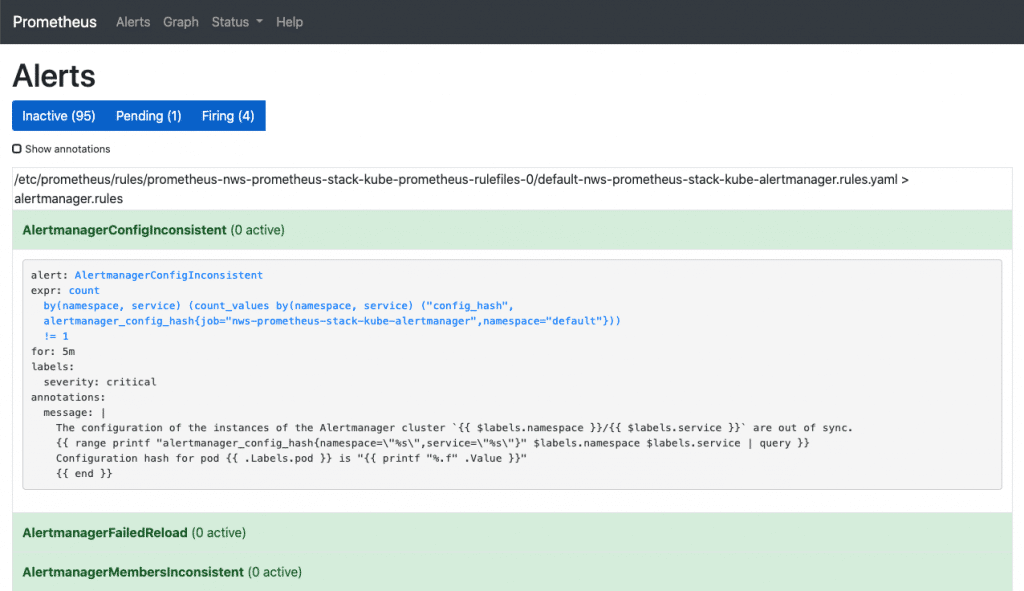
Under Alerts you can see all the alarm rules that are already pre-configured in the stack. By clicking on any rule, you can see its definition. However, nothing can be configured here either. Using the buttons “Inactive”, “Pending” and “Firing”, the rules can be shown or hidden with their respective status.
We go to the next web interface – Alert manager. Here, too, we need a port forward.
kubectl port-forward service/nws-prometheus-stack-kube-alertmanager 3004:9093
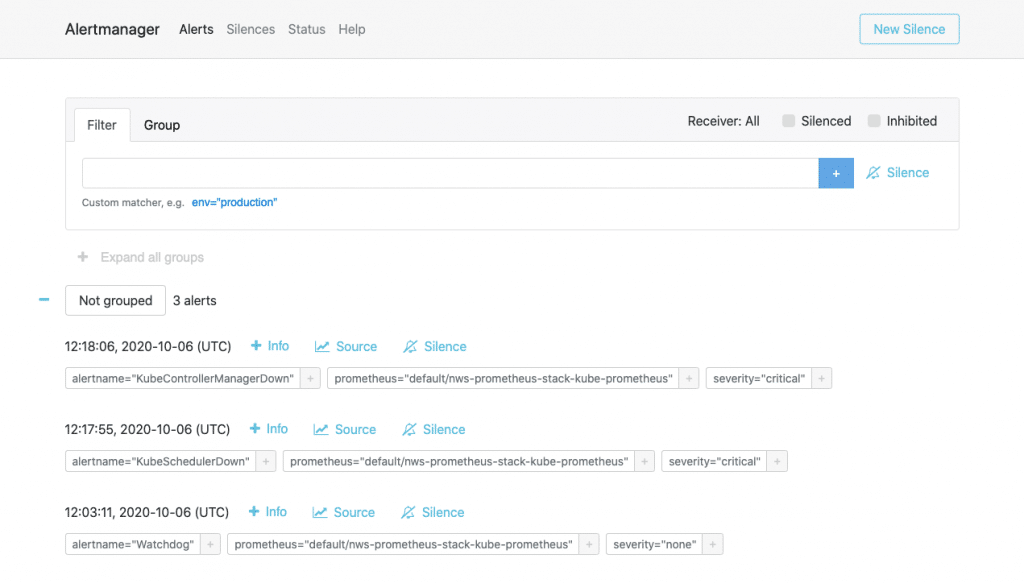
The web interface (accessible at http://localhost:3004/) is similar to that of Prometheus. Under Alerts, however, you have a history of alerts that have already been triggered. Silences shows an overview of the suppressed alerts and Status contains version information and the operating status as well as the current config of the alert manager. Unfortunately, this config cannot be changed here either.
So how do we configure the alert manager?
Configuring the Alert Manager
Some will have guessed it already: by adjusting the values of the Helm Chart. So we write a new values file that contains only the alert manager config. The documentation shows us which options are available and how they can be set. We start with a basic example and first add global SMTP settings:
alertmanager-v1.values
alertmanager:
  config:
    global:
      resolve_timeout: 5m
      smtp_from: k8s-alertmanager@example.com
      smtp_smarthost: mail.example.com:587
      smtp_require_tls: true
      smtp_auth_username: k8s-alertmanager@example.com
      smtp_auth_password: xxxxxxxxx
    route:
      receiver: 'k8s-admin'
      routes: []
    receivers:
    - name: 'k8s-admin'
      email_configs:
      - to: k8s-admin@example.com
This enables the alert manager to send out e-mails. Of course, it is also necessary to define at least one recipient. Under “receivers” you can simply enter the name and e-mail address as in this example. Please make sure that the text indentation is correct, otherwise there may be start-up problems with the alert manager when rolling out the config.
To ensure that the alerts are actually delivered, the routes must be defined under “route”. If you first want to send all triggered alerts to one contact, then you can do this as in my example. We will take a closer look at what else can be done with routes in a later example. With a Helm upgrade we can deploy our new configuration for the alert manager. We will take over all the values already set by means of “-reuse-values”:
helm upgrade --reuse-values -f prom-config/alertmanager-v1.values nws-prometheus-stack prometheus-community/kube-prometheus-stack
And how do we test this now?
Testing Alerts
If you don’t want to launch a node straight away, you can simply restart the alert manager. When it is started, the “Watchdog” alert rule is triggered. This is only there to test the proper functioning of the alerting pipeline. This is how you can carry out the restart:
kubectl rollout restart statefulset.apps/alertmanager-nws-prometheus-stack-kube-alertmanager
Shortly after the restart, the e-mail should arrive. If not, first check whether the alert manager is still starting. If it hangs in a crash loop, you can find out what is going wrong by looking at the pod’s logs. If a config option is set incorrectly, you can adjust it again in the values and deploy again with a Helm upgrade. If you have mistyped an option key, you can roll back to a previous status using the Helm Rollback:
helm rollback nws-prometheus-stack 1
This gives us a rudimentary monitoring system for the Kubernetes cluster itself. Of course, you can add more receivers and therefore also notify several contacts.
Add your own Metrics and Alert Rules
Now we’ll take a look at what the routes can be useful for. However, we will first boot up a few pods for testing and create different namespaces. We will also take a quick look at the Prometheus Blackbox Exporter.
Scenario: In a K8s cluster, different environments are operated via namespaces – e.g. development and production. If the sample app of the development namespace fails, the on-call team should not be alerted. The on-call team is only responsible for failures of the sample app of the production namespace and receives notifications via email and mobile phone. The developers are informed separately by e-mail about problems with the sample app from the development namespace.
We define the two namespaces nws-production and nws-development in namespaces-nws.yaml:
apiVersion: v1
kind: Namespace
metadata:
  name: nws-development
  labels:
    name: nws-development
---
apiVersion: v1
kind: Namespace
metadata:
  name: nws-production
  labels:
    name: nws-production
kubectl apply -f ./prom-config/namespaces-nws.yaml
Now we start two sample apps that alternately return HTTP 200 and HTTP 500 in a 60 second interval. I am using a simple image that I created for this purpose (sources on GitHub).
sample-app.yaml:
apiVersion: apps/v1
kind: Deployment
metadata:
  name: nws-sample-app
spec:
  replicas: 1
  selector:
    matchLabels:
      app: nws-sample-app
  template:
    metadata:
      labels:
        app: nws-sample-app
    spec:
      containers:
      - name: nws-sample-app
        image: gagaha/alternating-http-response
        ports:
        - containerPort: 80
kubectl apply -f prom-config/sample-app.yaml -n nws-production
kubectl apply -f prom-config/sample-app.yaml -n nws-development
We then expose the app in the cluster:
kubectl expose deployment nws-sample-app -n nws-production
kubectl expose deployment nws-sample-app -n nws-development
Now, however, we need a component that can query the availability of these apps via HTTP request and provide them as metrics for Prometheus. The Prometheus Blackbox Exporter is a good choice for this. It can be used to check not only HTTP/HTTPS requests but also connections with the DNS, TCP and ICMP protocols.
First we have to deploy the Blackbox Exporter in the cluster. Again, I use the official Helm Chart.
helm install nws-blackbox-exporter prometheus-community/prometheus-blackbox-exporter
Now we have to tell Prometheus how to get the black box exporter. The targets are interesting here. Here we enter the HTTP endpoints that are to be queried by the Blackbox Exporter. We write the additional configuration in a file and deploy it via Helm Upgrade:
prom-blackbox-scrape.yaml
prometheus:
  prometheusSpec:
    additionalScrapeConfigs:
     - job_name: 'nws-blackbox-exporter'
       metrics_path: /probe
       params:
         module: [http_2xx]
       static_configs:
        - targets:
           - http://nws-sample-app.nws-production.svc
           - http://nws-sample-app.nws-development.svc
       relabel_configs:
        - source_labels: [__address__]
          target_label: __param_target
        - source_labels: [__param_target]
          target_label: instance
        - target_label: __address__
          replacement: nws-blackbox-exporter-prometheus-blackbox-exporter:9115
helm upgrade --reuse-values -f prom-config/prom-blackbox-scrape.yaml nws-prometheus-stack prometheus-community/kube-prometheus-stack
If we then start the port forward for Prometheus again, we can see the two new targets of the nws-blackbox-exporter under http://localhost:3003/targets. And therefore metrics for Prometheus are already coming in. However, we also have to define new alert rules so that alerts can be issued for these metrics.
We edit the rules directly via Kubectl:
kubectl edit prometheusrules nws-prometheus-stack-kube-k8s.rules
Before the k8s.rules we add our new rule:
...
spec:
  groups:
  - name: blackbox-exporter
    rules:
    - alert: HttpStatusCode
      annotations:
        description: |-
          HTTP status code is not 200-399
            VALUE = {{ $value }}
            LABELS: {{ $labels }}
        summary: HTTP Status Code (instance {{ $labels.instance }})
      expr: probe_http_status_code <= 199 OR probe_http_status_code >= 400
      for: 30s
      labels:
        severity: error
  - name: k8s.rules
    rules:
...
Now we only have to define the contact details of the different recipients and routes.
Under route you can specify different recipients in routes. Of course, these recipients must also exist below. Conditions can also be defined for a route. The notification is only sent to the specified recipient if the conditions apply.
Here is the config for the scenario:
alertmanager-v2.values
alertmanager:
  config:
    global:
      resolve_timeout: 5m
      smtp_from: k8s-alertmanager@example.com
      smtp_smarthost: mail.example.com:587
      smtp_require_tls: true
      smtp_auth_username: k8s-alertmanager@example.com
      smtp_auth_password: xxxxxxxxx
    route:
      receiver: 'k8s-admin'
      repeat_interval: 5m
      routes:
      - receiver: 'dev_mail'
        match:
          instance: http://nws-sample-app.nws-development.svc
      - receiver: 'bereitschaft'
        match:
          instance: http://nws-sample-app.nws-production.svc
    receivers:
    - name: 'k8s-admin'
      email_configs:
      - to: k8s-admin@example.com
    - name: 'dev_mail'
      email_configs:
      - to: devs@example.com
    - name: 'bereitschaft'
      email_configs:
      - to: bereitschaft@example.com
      pushover_configs:
      - user_key: xxxxxxxxxxxxxxxxxxxxxxxxxxx
        token: xxxxxxxxxxxxxxxxxxxxxxxxxxxxx
helm upgrade --reuse-values -f prom-config/alertmanager-v2.values nws-prometheus-stack prometheus-community/kube-prometheus-stack
It is best to restart the alert manager afterwards:
kubectl rollout restart statefulset.apps/alertmanager-nws-prometheus-stack-kube-alertmanager
Provided the configuration is correct, alerts should start arriving soon.
Conclusion
Setting up the alert manager can be time-consuming. However, you also have many configuration options and can set up your notifications via rules as you need them. If you wish, you can also edit the message templates and therefore adapt the format and the information contained.