Prometheus
Open Source Monitoring & Observability
Prometheus is a monitoring solution that continuously monitors your infrastructure systems, collecting data on availability and performance and generating alarms in the event of failures or problems.
Prometheus
Enterprise Monitoring
Enter the multiverse
Prometheus comes with a high-dimensional data model and its own query language for analysis, aggregation and processing of the data.
Distribution
As cloud-native projects, high availability and scalability can be easily implemented with Prometheus.
Visualization
Prometheus offers an integrated possibility for visualization. At the same time, extensions with, for example, Grafana are possible.
Monitor. Visualize. Alert.
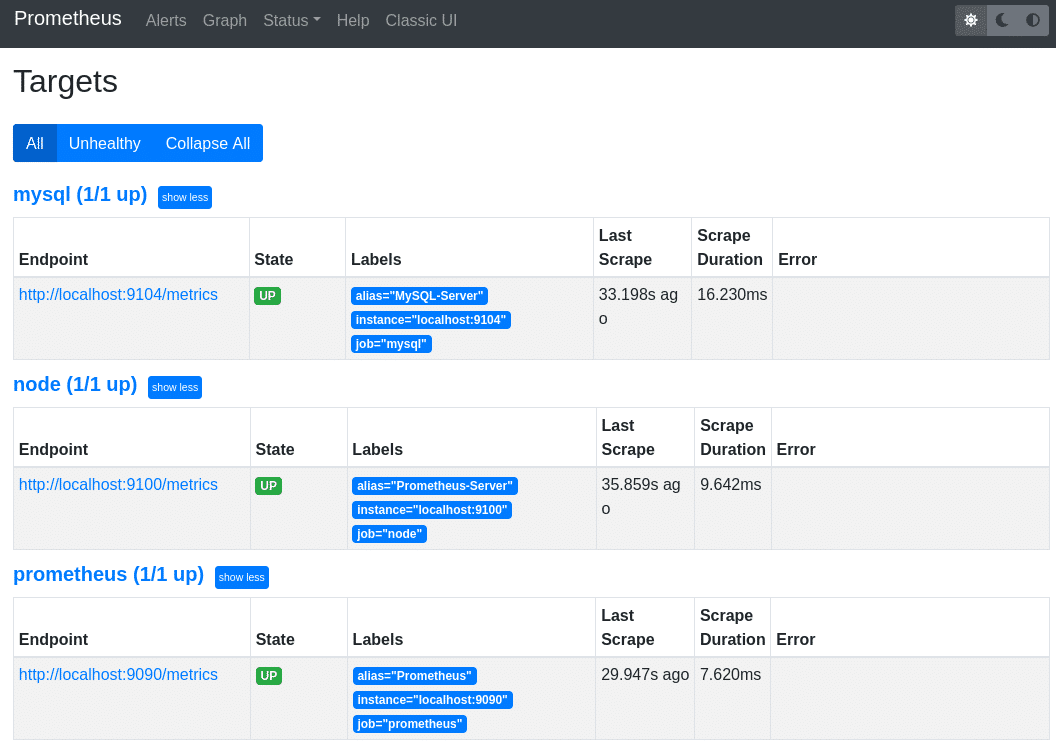
prom_targets_light

prom_targets_dark
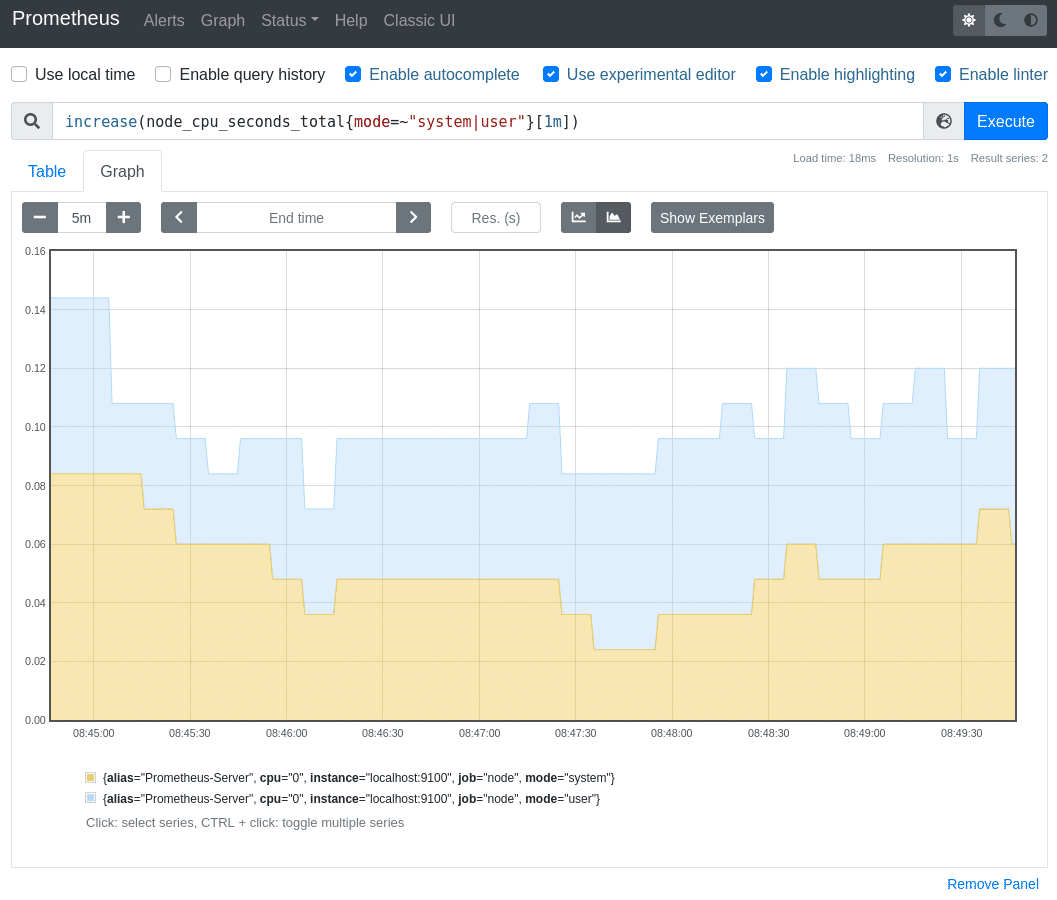
prom_node_light
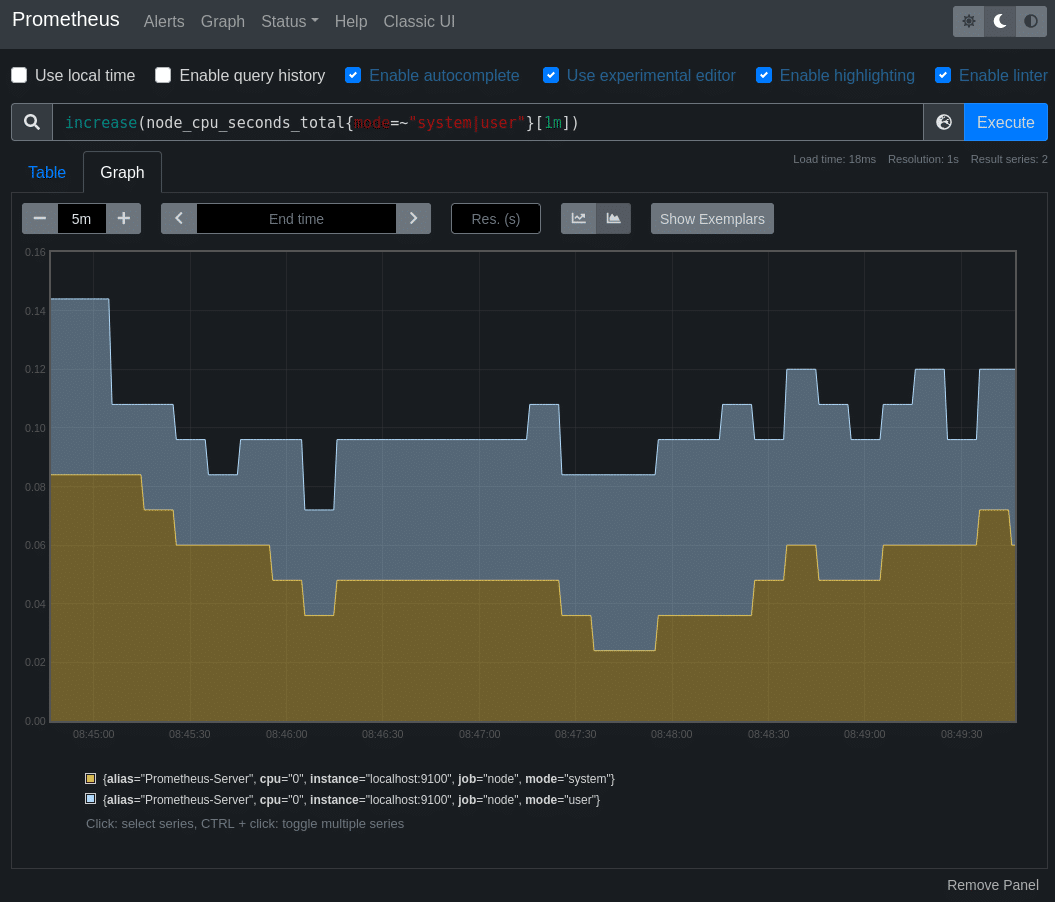
prom_node_dark

prom_mysql_light
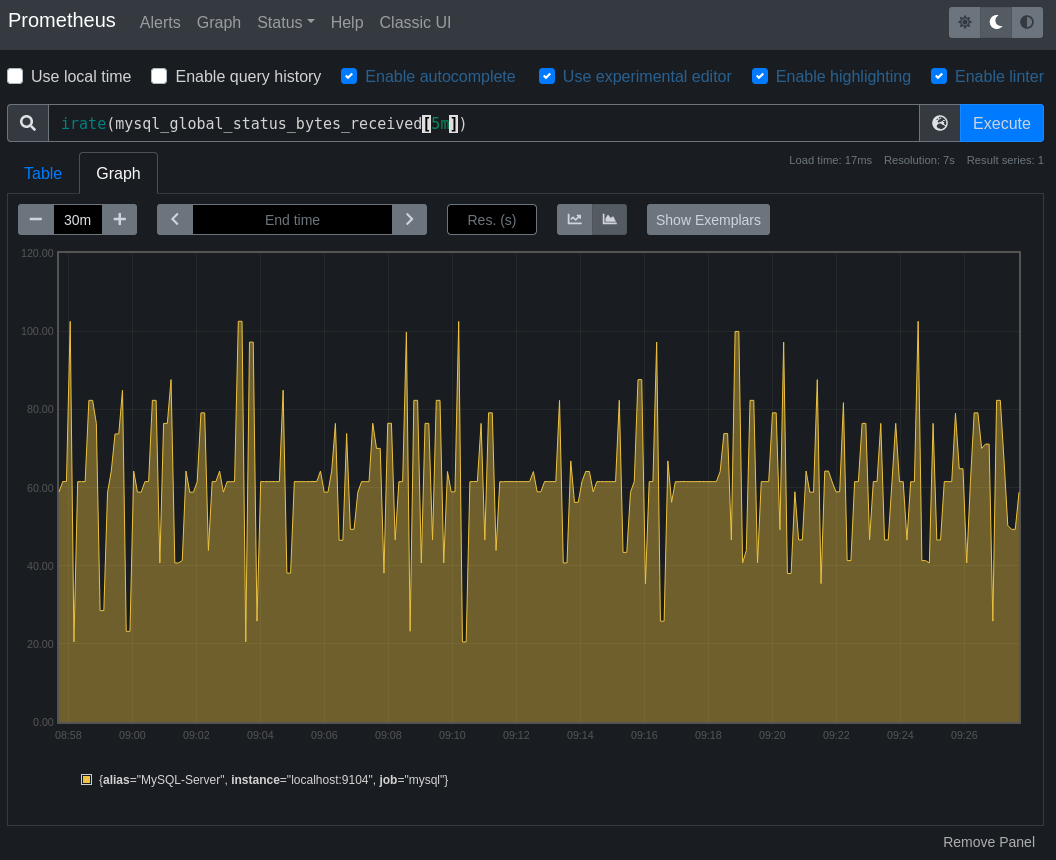
prom_mysql_dark

prom_http_light
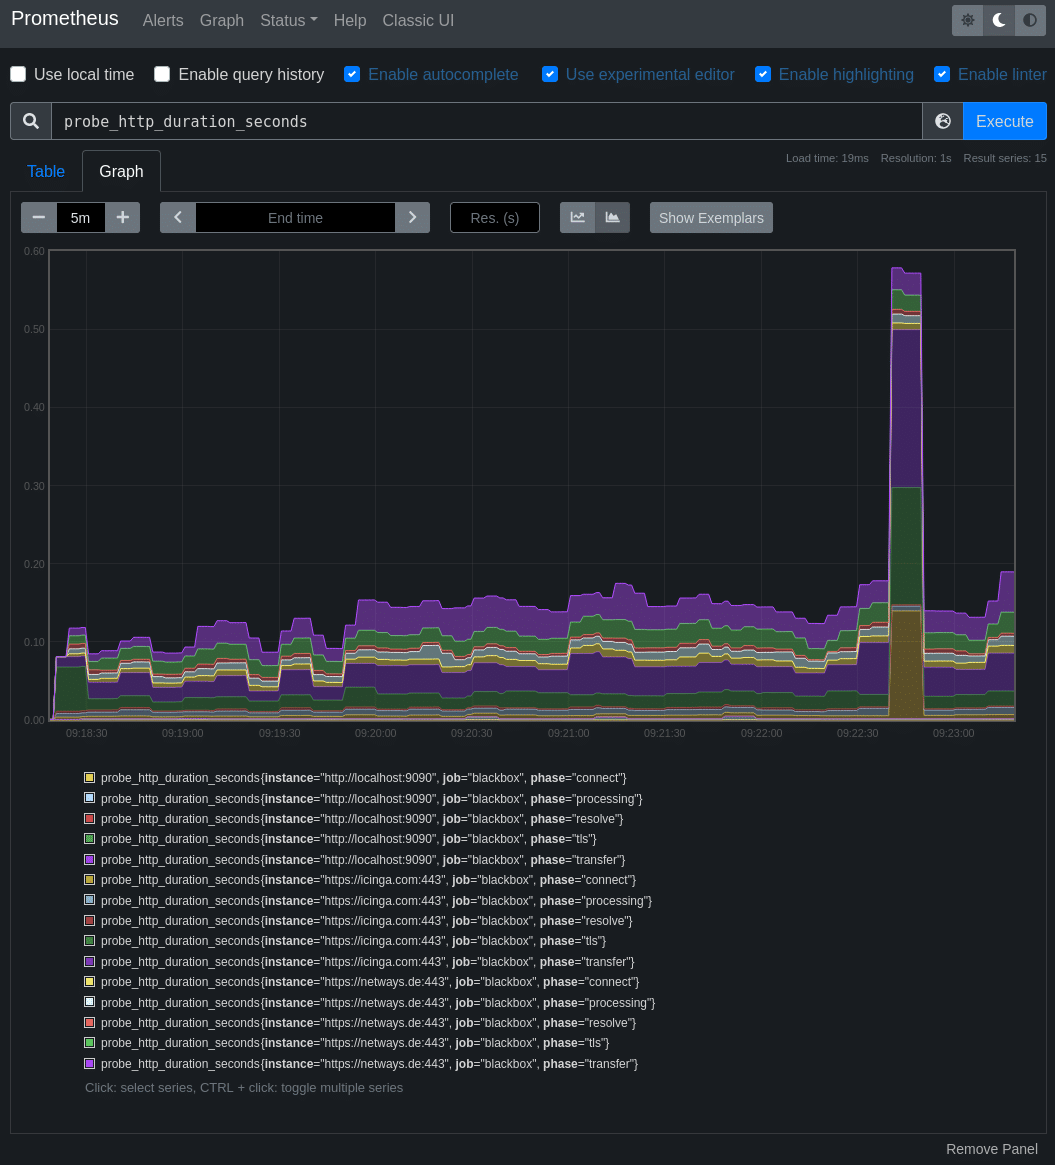
prom_http_dark
Features
From Metrics to Insights
Time series data
Prometheus comes with a high-dimensional data model that can be used to monitor process behavior, access metrics, error metrics, and workload at a high level of detail. This data can be processed, analyzed and aggregated using a proprietary query language.
Distribution
From a single instance to a highly available fleet, scalability is easy to implement with Prometheus as a cloud-native project. The Prometheus Alertmanager takes care of deduplication, grouping and targeted notifications.
Simplicity
Prometheus collects metrics on predefined endpoints over common HTTP connections. Each Prometheus instance runs standalone and is built on local POSIX-compliant storage.
Visualization
Prometheus offers an integrated visualization option with which data can be evaluated ad hoc. At the same time, numerous extensions are possible with, for example, Grafana.
Integrations
Working with Prometheus
Prometheus not only offers comprehensive monitoring of your infrastructure, but can also be seamlessly integrated into existing tools and systems.
Continuously collect critical data on availability and performance and receive precise alerts in the event of failures or problems.
Optimize your network monitoring and work more efficiently with seamless Prometheus integration.
Icinga
In combination with Icinga, Prometheus enables holistic monitoring. This integration improves infrastructure monitoring, enables precise alerting, and supports custom monitoring rules and detailed reporting for optimized system management.
Grafana
InfluxDB
This integration enables efficient storage and retrieval of monitoring data, facilitating long-term monitoring and trend analysis.
Development
Your wishes – our solutions
We develop Prometheus Exporter for you – from simple adjustments to custom exporters.
Exporters provide the data for Prometheus. A large number of existing exporters for Prometheus can be used or created individually with the help of numerous program libraries.
Service
Prometheus Consulting
We help you with the conception, installation and integration of your environment – for more power, know-how, peace of mind!
Power
Years of experience
We have been supporting our customers in operating their IT infrastructures for many years. Industries, tools, operating systems – we’ve seen, operated and built everything. We know the best practices with Grafana, Prometheus, InfluxDB & Co. and many topics related to Open Source and Linux.
Know How
Full Understanding
We not only understand your IT systems and services, but the big picture and the countless aspects of operating complex IT infrastructures. There is often a lack of time and personnel with increasing complexity and a rapidly changing IT world.
Peace of Mind
Targeted Reinforcement
As Linux generalists and open source experts, we have a broad base and are well integrated into the open source communities. With us you are never alone! Whether as an IT consultant, engineer, support or architect – we strengthen your team and relieve you of work.
Everything from a single source
The holistic portfolio of NETWAYS
You need support with the planning, implementation and operation of your Prometheus environment. NETWAYS supports you in all matters relating to consulting, outsourcing and, of course, training.
IT Outsourcing
As an external IT department, we take over the complete operation of entire environments. We take care of all the necessary systems from the open source world and work with you.
Support
With us you get quick help from your personal systems engineer. Whether by phone, chat, email or ticket: we are always there for you! Prometheus not doing what it’s supposed to? Get it contact with us!
Trainings
We are happy to pass on our extensive and profound practical knowledge to you in our training courses and workshops. Of course, as face-to-face and of course online training.
Starter Pack
The simple beginning of something big
With our Prometheus Consulting offer, we want to make it easier to get started with monitoring with Prometheus and offer a cost-effective way of getting to know the open source system. Without having to make major financial advance payments, as is often the case with commercial products.
Our experienced consultants are available to you remotely for one to four days, set up the system directly and teach the basics for further operation. The package is billed at a fixed price and there are no additional costs.
Of course we also offer you every possible Prometheus custom solution in every size – just talk to us.
Prometheus Review - Day 1
- Discussion of your goals and requirements
- Selection of suitable solutions/technologies
- Support in selecting the right hardware
or - Support in choosing the right hoster
(also with us: nws.netways.de)</li > - Planning the rollout of your monitoring environment
Prometheus Kickstart - 2-4 Days
Day 1+2:
- All content from Prometheus Review
- Installing Prometheus
- Installation of various exporters
- Introduction to PromQL
- Example monitoring of Linux servers
- Example monitoring of Windows servers
- Example of monitoring a database (MySQL, PostgreSQL)
- Example of monitoring a website
- Example of monitoring network components via SNMP
- Installation of Alert Manager
- Setting up email notifications
Possible topics for days 3-4 (optional):
- Installation of the push gateway
- High availability configuration
- Configuration of remote endpoints and storage
- Integration with Grafana
- Prometheus Federation configuration
- Configuration of remote endpoints and storage
- Configuration of security-related topics
- Installation of the push gateway
- Integration with Grafana
- Development of own exporter
- Deep dive into PromQL
- Insight to Prometheus Best Practices
Prometheus Custom
We plan and build your new Prometheus environment of any size with you – on premise or with the hoster of your choice.
News
Posts from our Blog

Herausforderungen beim Prometheus Scaling
Prometheus ist eine ausgezeichnete Monitoring-Lösung, wenn es um die Überwachung von Verfügbarkeit und Performance geht. Das initiale Deployment geht schnell und mit ein bisschen PromQL KnowHow hat man die Dashboards und Alarme schnell am Laufen. Schon steht die...
check_prometheus ist jetzt öffentlich verfügbar!
Monitoring ist komplex, das wissen wir hier bei NETWAYS leider zu gut. Deswegen laufen in der Infrastruktur auch mal gerne mehrere Tools für die Überwachung. Zwei gern gesehene Kandidaten sind dabei Icinga und Prometheus. Icinga und Prometheus erfüllen...
 Subscribe