Grafana
State of the art Data Analysis and Visualization
Grafana
The open source platform for Metric Analysis
With Grafana, metrics can be queried, viewed, and alerted, no matter where they are stored. Create, explore and share the dashboards with your team and encourage a data-centric culture.
Visualization
Alarming
Standardization
Features
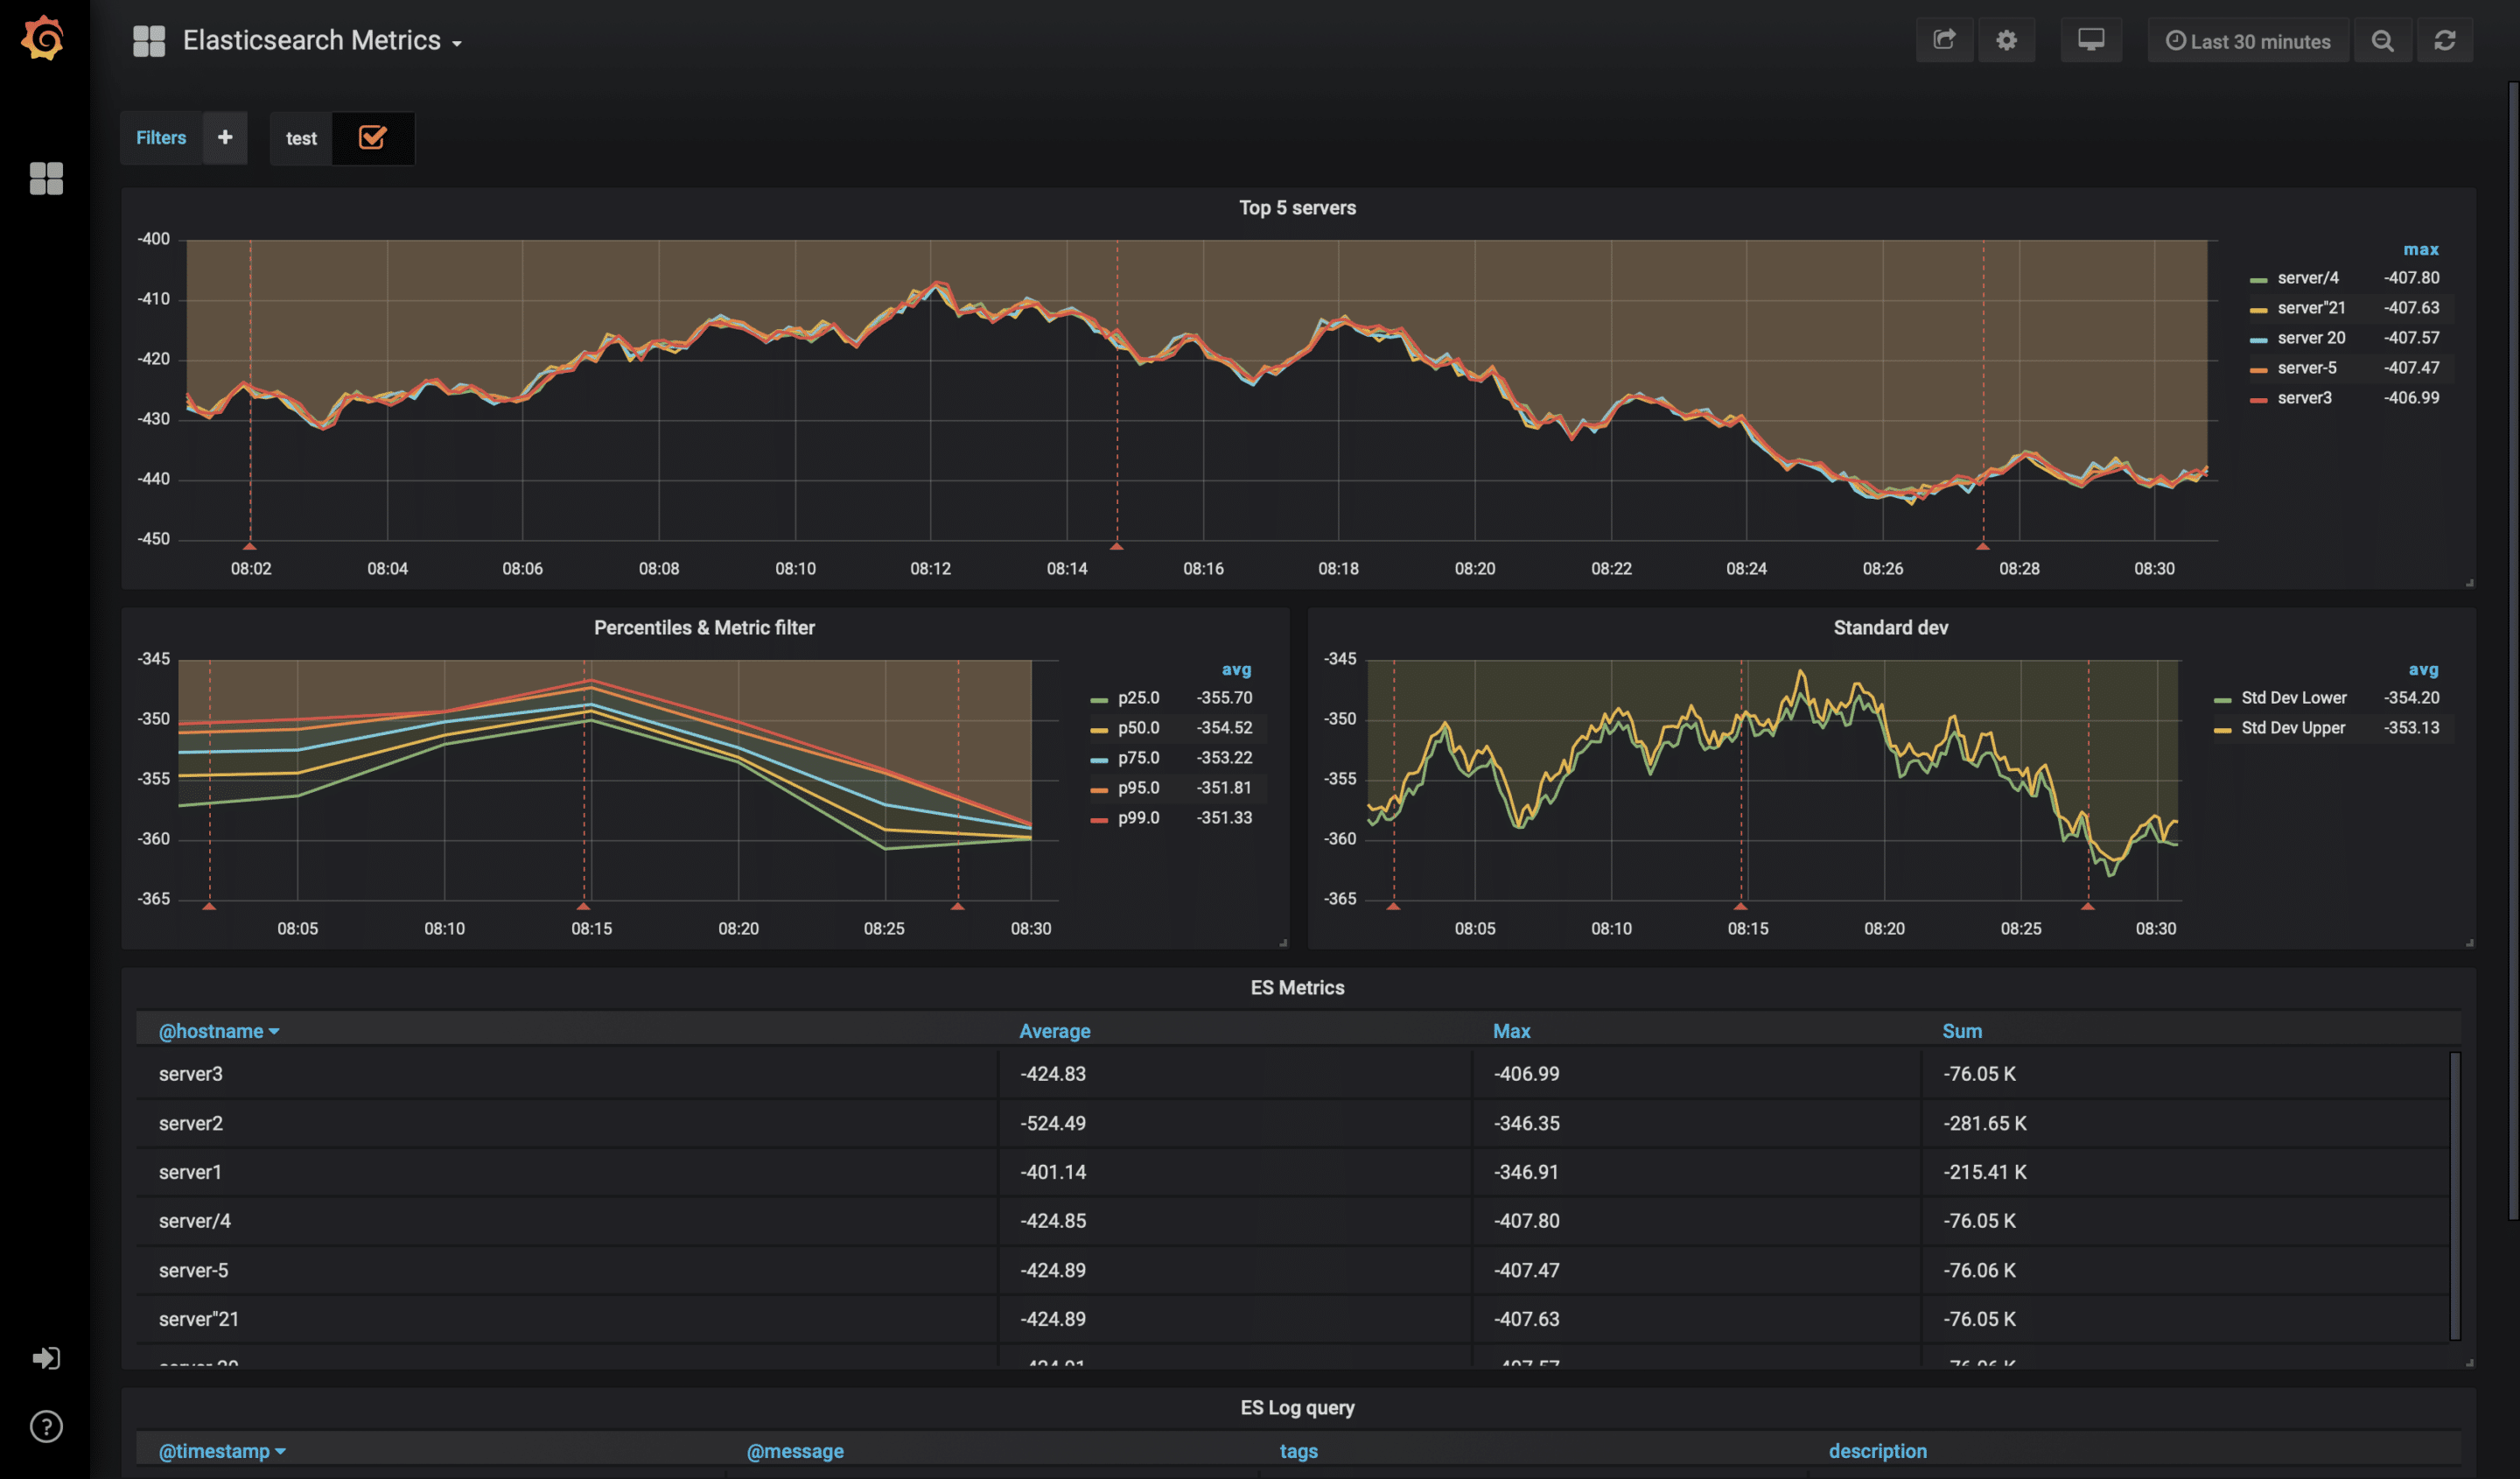
All the data in one interface
Grafana can generate a complete data view from more than 30 different data sources. It is not limited to simple graphs, but also supports different alarms. After defining the appropriate thresholds, Grafana immediately alerts and sends the current graph as well.
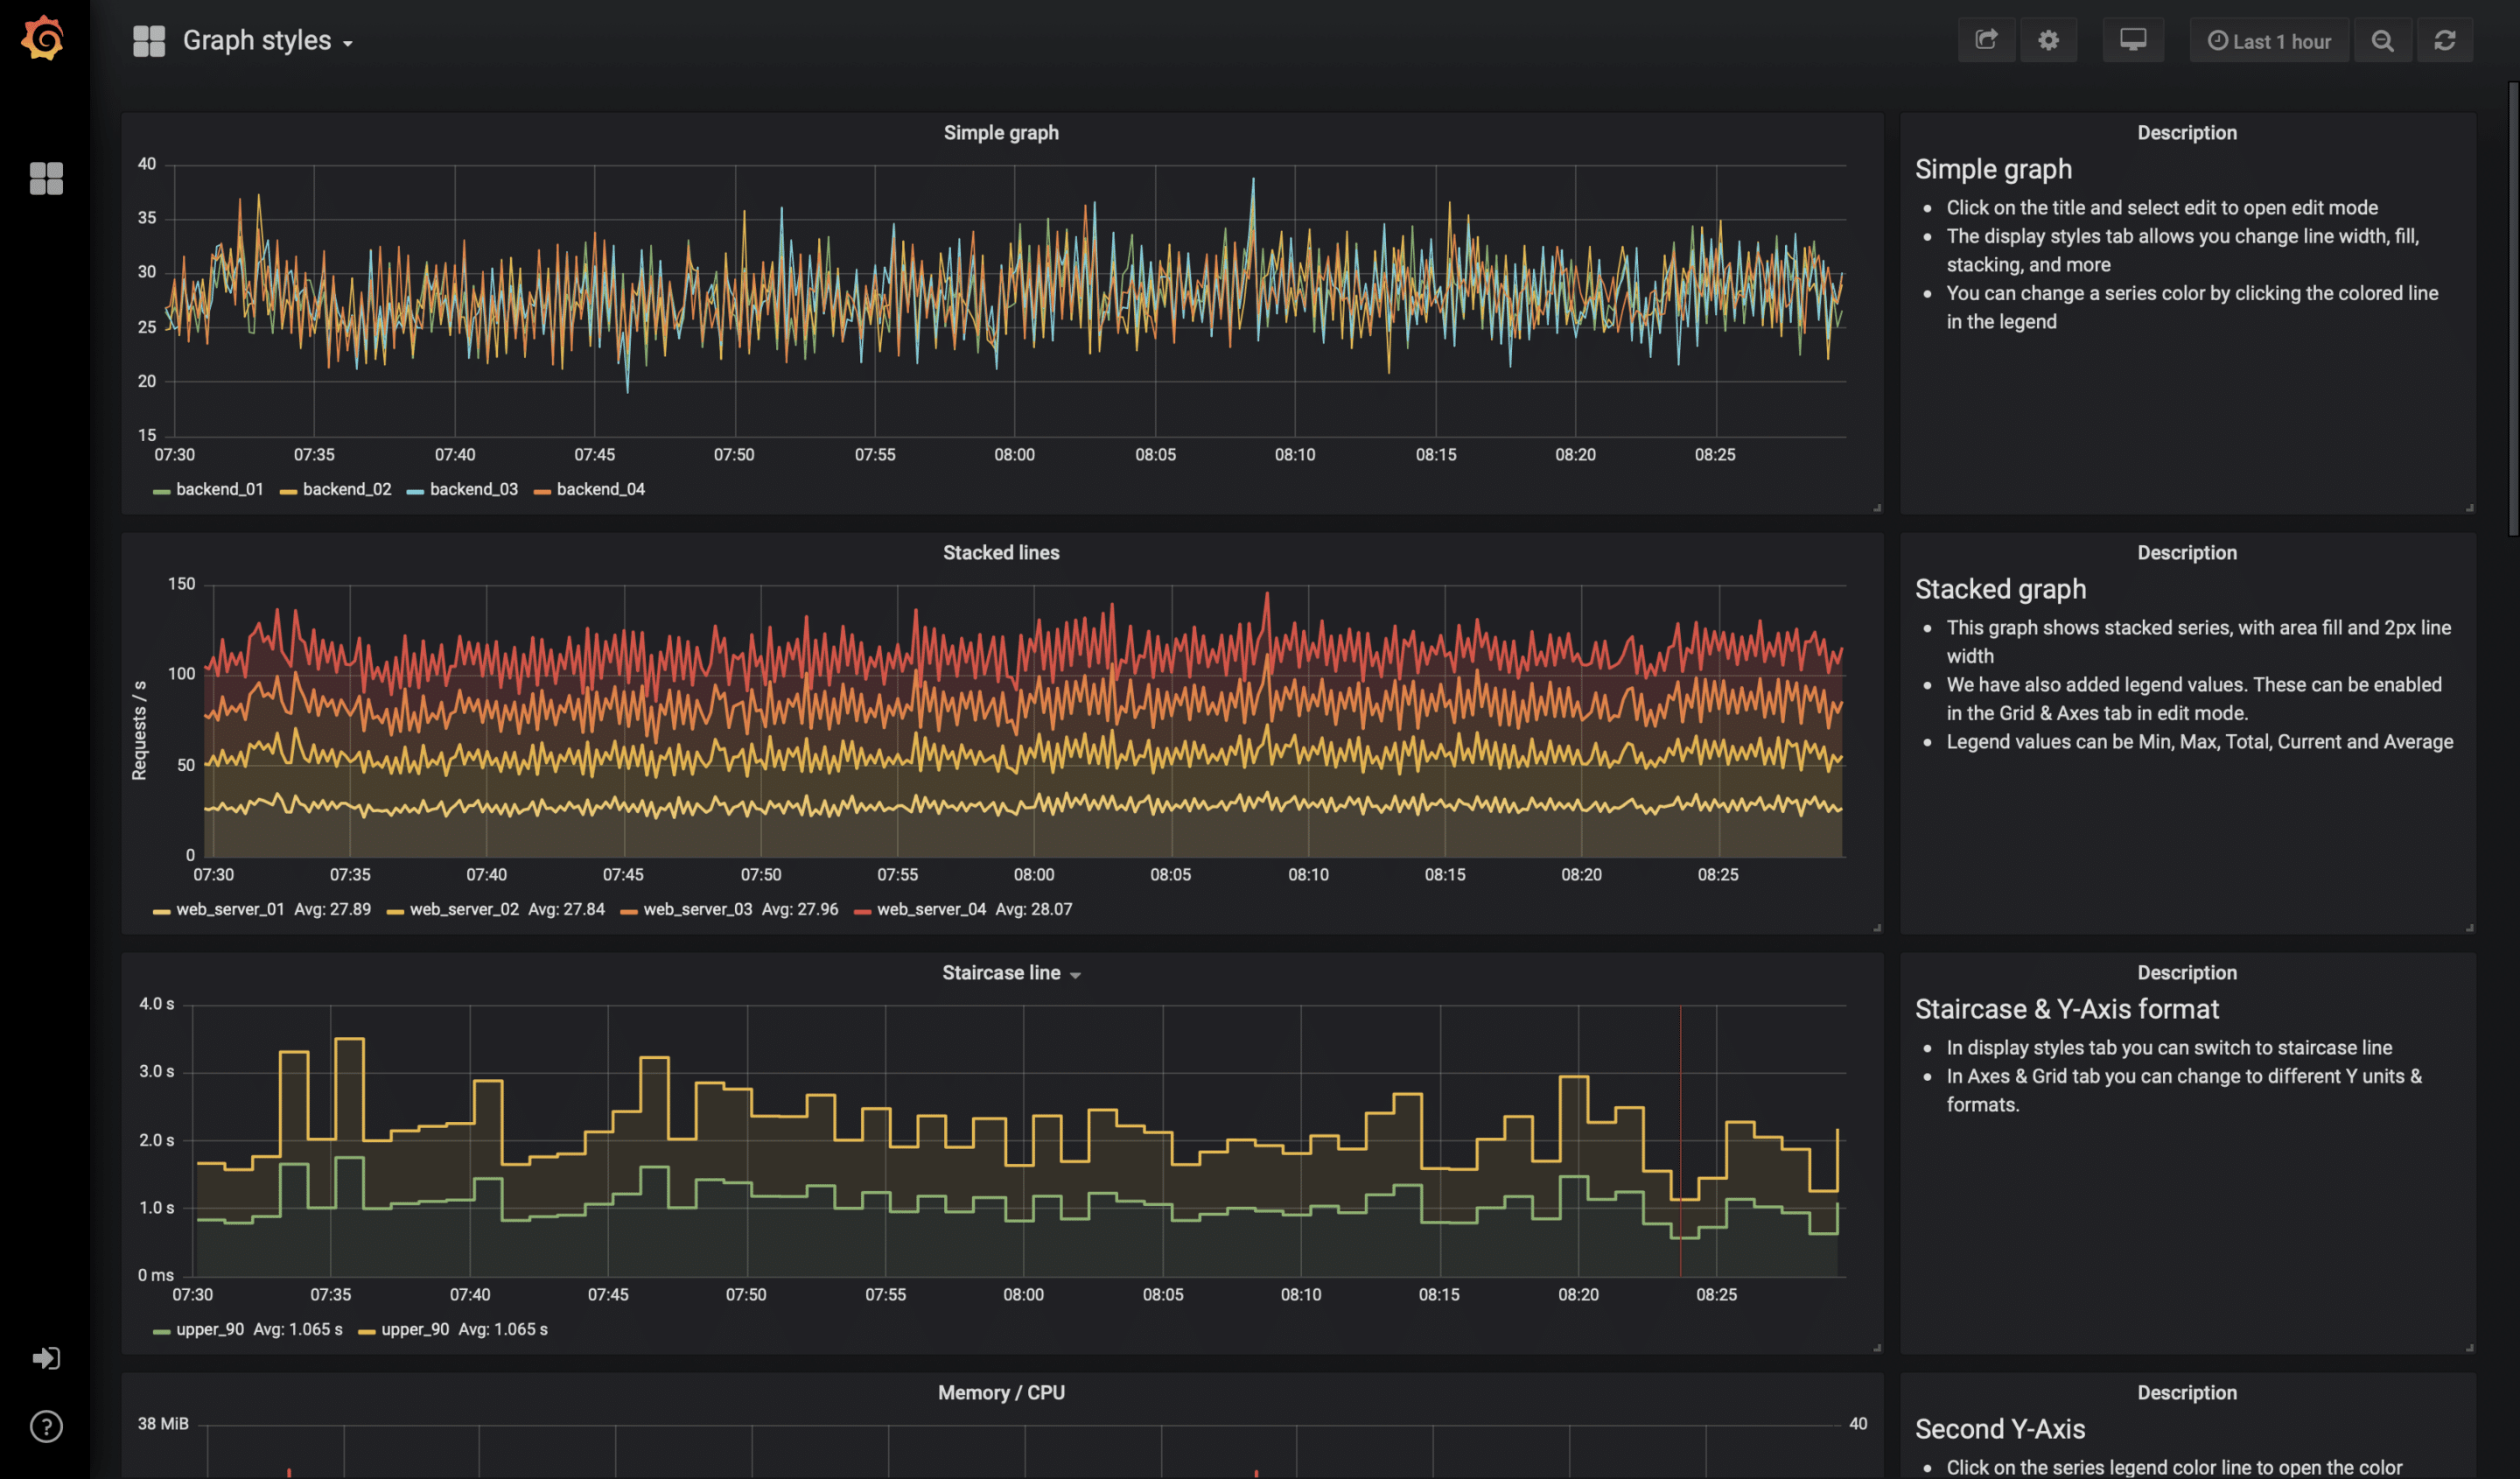

Styles
Fast and flexible client-side charts with a variety of options make analysis a breeze. Various panel plugins to display metrics and logs are also available.
Variety of data sources
Alarming
Data sources
Data sources for Grafana
Grafana doesn’t require you to consolidate data into a backend storage or central database. Instead, Grafana takes a unique approach to provide you with a “single pane of glass” by visually bringing your existing data together in one place, wherever it resides.
With Grafana, you can take any existing data – be it from your Kubernetes cluster, your Raspberry Pi, various cloud services or even Google Sheets – and visualize it however you want, all from a single dashboard.
Service
Grafana Consulting
We help you with the conception, installation and integration of your environment – for more power, know-how, peace of mind!
Power
Years of experience
We have been supporting our customers in operating their IT infrastructures for many years. Industries, tools, operating systems – we’ve seen, operated and built everything. We know the best practices with Grafana, Prometheus, InfluxDB & Co. and many topics related to Open Source and Linux.
Know How
Full Understanding
We not only understand your IT systems and services, but the big picture and the countless aspects of operating complex IT infrastructures. There is often a lack of time and personnel with increasing complexity and a rapidly changing IT world.
Peace of Mind
Targeted Reinforcement
As Linux generalists and open source experts, we have a broad base and are well integrated into the open source communities. With us you are never alone! Whether as an IT consultant, engineer, support or architect – we strengthen your team and relieve you of work.
Everything from a single source
The holistic portfolio of NETWAYS
You need support with the planning, implementation and operation of your Grafana environment. NETWAYS supports you in all matters relating to consulting, outsourcing and, of course, training.
IT Outsourcing
Support
Trainings
News
Posts from our Blog
Icinga for Windows Preview: Visualisiert eure Metriken!
Icinga hat in seinem Blogpost mitgeteilt, dass es mit Icinga for Windows v1.10.0 einige Änderungen an den Performance Metriken geben wird. Hier wollen wir einmal grob zusammenfassen, worum es geht und welche Auswirkungen diese Änderungen haben. Für alle Details ist...

Grafana queries InfluxDB
Christoph hat euch ja bereits in einem früheren Blogpost vor ca. einem Jahr näher gebracht wie man Icinga 2 und InfluxDB 2 miteinander "zum Reden" bringt. Seit Icinga 2.13 steht nun auch der Influxdb2Writer zur Verfügung, welchen Afeef in seinem Blogpost benützt. Ich...
 Subscribe