Those of you who have been following the ongoing development of NoMa in the GIT repository
know that there are lots of exciting new features in the 2.x series; SQLite support, an improved configuration interface, a powerful timeframe concept, and much more.
Now finally we’ve packaged it all into a release 2.0.2 (with an installer, and updated documentation 🙂 ) available at http://www.netways.org/projects/noma/files
Many thanks go to Rune “TheFlyingCorpse” Darrud and Sebastian Wolf for all their hard work
on the project.
NETWAYS Blog
Switch monitoring via SNMP
Chances are you will at some point need to monitor a switch, and the Nagios community offers many plugins to do this.
Because no two setups are exactly the same, there are two interface checks actively maintained by NETWAYS which are designed for very different environments.
The first plugin was designed for monitoring large numbers of switches over low-bandwidth links, and is optimized for minimal system load.
check_interfaces (www.netways.org/projects/check-interfaces)

* very fast c-based plugin
* uses bulk get mode to reduce traffic
* runs on embedded appliances
* no external status files required
* SNMP v1, 2c and 3 supported
* 10GB port support
* fully integrated into Nagios 3 / Icinga
* 64 bit counter support
* Interface aliases
* Human-readable bandwidth measurement
* PNP compatible output
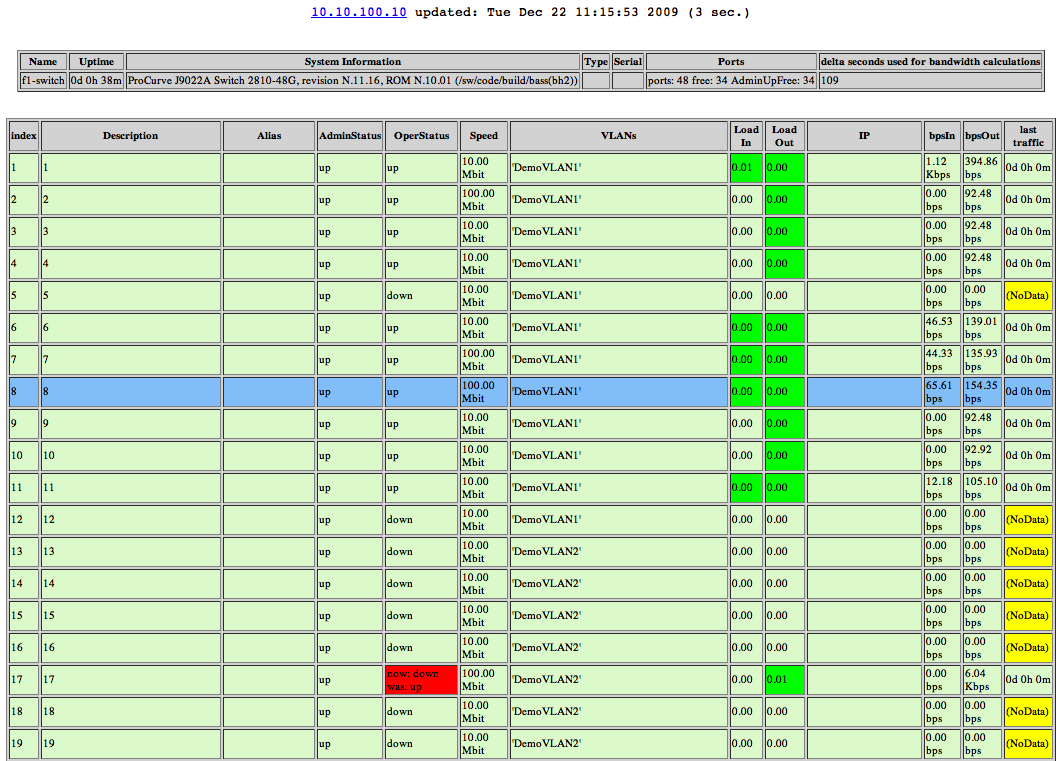
The second plugin is orientated towards large switches, and offers a graphical overview of the switch status.
check_interface_table_v2 (www.netways.org/projects/plugins/files)
* adapted from check_interface_table from ITdesign
* Perl-based plugin
* Separate colour HTML overview
* Monitor switch ports for changes
* VLAN support
* 64 bit counter support
* Interface aliases
* Human-readable bandwidth measurement
* PNP compatible output
Both are naturally GPL-Licensed and available for download from the usual places.
SAP monitoring simplified
 Monitoring SAP systems with Nagios or Icinga has been possible for a while with the SAP CCMS plugin hosted on SourceForge. It has some nice features, has however also a rather unusual configuration method which makes it difficult to work with.
And it doesn’t support unicode SAP systems. This problem was important, because we needed to connect to a Unicode system. Looking at the code, It seemed to be easier to start afresh with a brand-new plugin and take the opportunity to make the program more compliant with Nagios and Icinga. New features that it offers are:
- fast
- resource friendly
- easy to compile
- can connect to unicode SAP-Systems
- runs on 64-bit Linux
- has a simple command-line configuration
- switches to multi-line output (Nagios 3 compatible)
- has full-path matching capability
- outputs graphable performance data
- list mode allows easy searching for monitoring objects
You can find more details and download check_sap at netways.org.
Quick Tip: Testing Nagios Plugins
Sometimes when testing a Nagios Plugin on the command line, it’s useful to know the exit code.
You can always use echo $?, but that becomes tedious if you have to type it often.
Additionally you have to remember what the exit codes mean.
The following snippet adds a prompt that changes colour according to the exit code; 0 is green, 1 is yellow, 2 is red and 3 is grey. This makes it easy to see at a glance what the exit code was.
Add the following to a file e.g. debug.sh
export colormap=([0]=32 [1]=33 [2]=31 [3]=37)

export PS1='\[\e[${colormap[$?]}m\]\u@\h:\w\$\[\e[30m\] '
Then source it in .bashrc or on the command line with
source debug.sh
and enjoy.
nagios@localhost:~$ ./check_plugin 192.168.0.1
OK - 1824 bytes in 0.002 seconds
nagios@localhost:~$ ./check_plugin 192.168.0.2
Unable to open TCP socket
nagios@localhost:~$
Plugin fuer SEP Sesam
![]() …und hier gibt’s wieder ein Plugin aus einem Kundenprojekt. Das check_sepsesam Plugin ermöglicht die Überwachung des Backupsystems Sesam des Herstellers SEP.
…und hier gibt’s wieder ein Plugin aus einem Kundenprojekt. Das check_sepsesam Plugin ermöglicht die Überwachung des Backupsystems Sesam des Herstellers SEP.
Das Plugin kann via SSH oder NRPE abgefragt werden und erlaubt die Auswertung der letzten Backup Tasks gefiltert auf Hosts und Tasks. Es erlaubt außerdem die Angabe spezifischer Host- und Tasklisten sowie die Einschränkung auf angegebene Zeiträume um die mehrzeilige Ausgabe des Plugins zu konfigurieren. Auf Wunsch kann die Ausgabe der Performancedaten auch unterdrückt werden.
Es ist wie immer auf www.netways.org und MonitoringExchange zu finden.


