Seite wählen

NETWAYS Blog

Profiling your application with Valgrind Callgrind: Icinga2

We are using a variety of tools to ensure that our applications do not leak memory, suffer from performance issues or actually trigger unwanted behavior. This tool stack changes over time, and it is also different for web, script and binary applications. Next to the Icinga bits I am responsible for the LConf Backend and other Perl foo here at NETWAYS – I’ve already written about profiling Perl. During Icinga 1.x and 2.x development we’ve come around a couple of tools for profiling memory consumption with Massif or using the Google perftools.
One of our specialties at NETWAYS Development is further that we’re capable of identifying and resolving issues directly – be it performance, memory, locking, race conditions, etc. aside from the code we’re developing and running at customers.

The perfect code vs performance

While the perfect code does not exist, it’s always interesting and also required to refactor your own code parts based on current conditions and requirements. The code in 2.2.4 had one function interface being called, namely AddObject(). This function is merely doing the following for ‚repository add‘ and ’node update-config‘:

  • Get all the object names from `repository.d` and checking if the added object already exists
  • Create a new object by attributes and run it against the Icinga 2’s config validation
  • Check if the change already exists by reading the `changes` directory
  • Add the change to the changelog (for calling ‚commit‘ later on)

This is perfectly fine for keeping the same functionality shared among several occasions where this code is used. But we’ve run into severe performance issues with like 20000 calls to AddObject() inside one ’node update-config‘ run.

How to tackle the problem

Valgrind provides a tool named callgrind which tracks the function calls and time of a specific binary being run. While this is a bit slower than the Google perftools, it provides more detailed data. The ‚callgring.out.PID‘ file can then be visualized in KCacheGrind.
Install Valgrind alongside with KcacheGrind. I’m using Fedora 21, other distributions use similar package names.

# yum install valgrind kcachegrind graphviz

In order to profile Icinga 2 with all debug symbols included, I’m compiling Icinga 2 with debug symbols enabled: -DCMAKE_BUILD_TYPE=Debug (Note: Using Icinga 2 packages you’ll get a separate package).
Valgrind requires a bunch of parameters which are easier being modified in a small script. I’m also running the direct debug build binaries instead of the installed binary here. Generating some sort of huge debug config inside the Icinga 2 cluster and node inventory is left to the reader’s imagination 😉 (I’ll write a different blog post for that sooner or later).

# vim callgrind_icinga2
#!/bin/bash
valgrind \
-v \
--trace-children=yes \
--tool=callgrind \
--simulate-cache=yes \
--collect-jumps=yes \
--dump-instr=yes \
--dump-line=yes \
/home/michi/coding/icinga/icinga2/debug/Bin/Debug/icinga2 node update-config
# sudo ./callgrind_icinga2

If you want to enforce a manual dump before the program ends, you can invoke the following command:

# callgrind_control -d


Visualize and analyze the bottlenecks

Opening the callgrind.out file(s)

$ sudo kcachegrind callgrind.out.16903

unveiled that there were certain unnecessary calls to generic functions.

  • Getting objects/changes on each AddObject() call is useless
  • ’node update-config‘ would cause AddObject() to validate each object. But we know already we’re right not parsing user’s input from the cli arguments.

Solve the problem

Refactoring the code and allowing to pass one-time collected objects/changes as well as suppressing configuration validation solved the problem in the end. Still it unveiled that you should sometimes stop feature development and profile your own application 🙂
Memory footprint von Scripts

Hin und wieder stellt sich die Frage in welcher Sprache man ein Programm eigentlich schreiben sollte. Neben persönliche Vorlieben, Features und Modellen welche die Sprache unterstützen soll, gilt es aber auch ein Auge auf der Performance zu haben.
Bevor es nun ungezähmt aus dem Wald schallert: „Klar, C, schneller geht’s kaum“, wage ich anzumerken dass auch die Performance in der Schreibgeschwindigkeit zählt, oder der Praktikabilität, usw. Allerdings interessiert mich in diesem Artikel mehr der Speicherverbrauch.
Scriptsprachen welche meistens dynamisch typisieren oder eine Mischform aus dynamischer und statischer Typisierung verwenden brauchen oft mehr Speicher als eigentlich nötig. Daraus würde ich gerne einen Vergleich aus den populärsten Sprachen ziehen.
Basis hierfür ist ein 10.9673 MB großer JSON Dump (sagen wir halt 11MB), mit 100000 Objekten innerhalb eines Arrays. Als Implementierung wurde immer die kleinste gewählt, möglichst streams, keine Zwischenspeicher und keine Ausgabe (Ergebnis wurde natürlich vorher geprüft bevor mit der Zeitnahme begonnen wurde.
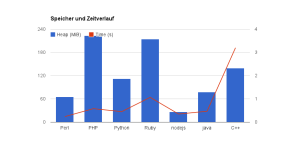
Die Messung wurde mit Valgrind durchgeführt (mit dem tool massif) und als Vergleichswert der maximale Peak in Mebibyte gemessen.

chart_time2

Nun, verloren hat ganz klar – und auch leider – PHP. Mit fast 240 Mebibyte aufgeblasenen Heap wundert man sich fast schon was eigentlich drin steht – im Speicher. Ganz gut im Mittelfeld platziert sich der Liebling der Administratoren, Perl – Gut schnell und annehmbarer Speicherverbrauch. Node ist zwar schnell aber nicht weit verbreitet weshalb es eher (auch hier ein klares leider) ein klares Schattendasein führt. Zu C++ ist noch zu sagen das hier alles Dynamisch angelegt und ein großes Framework verwendet wurde, weshalb das Ergebnis kaum zu rechnen ist.
Dieser Test ist natürlich auch in keinster Weise repräsentativ. Werden doch Shared Objects in den Speicher geladen und andere Dinge unternommen welche einen objektiven und ausgeglichenen Vergleich kaum zulassen. Aber man kann doch Stärken und Schwächen erkennen, da es sich zumindest bei den Scriptsprachen um Standardinstallationen aus einem Ubuntu (12.04 LTS) System handelt. Ansonsten folgen noch ein paar hübsche Graphen.


Marius Hein
Marius Hein
Head of IT Service Management

Marius Hein ist schon seit 2003 bei NETWAYS. Er hat hier seine Ausbildung zum Fachinformatiker absolviert und viele Jahre in der Softwareentwicklung gearbeitet. Mittlerweile ist er Herr über die interne IT und als Leiter von ITSM zuständig für die technische Schnittmenge der Abteilungen der NETWAYS Gruppe. Wenn er nicht gerade IPv6 IPSec Tunnel bohrt, sitzt er daheim am Schlagzeug und treibt seine Nachbarn in den Wahnsinn.

Memory-Profiling mit Massif

Mit dem Heap-Profiler Massif kann man schnell herauszufinden, welcher Teil eines Programms am meisten Arbeitsspeicher verbraucht. Massif ist Teil von Valgrind und kann unter Ubuntu z.B. so installiert werden:

$ sudo aptitude install valgrind

Danach kann man das zu profilende Programm mit Massif starten:

$ valgrind --tool=massif ./pfad/zum/eigenen/programm --parameter

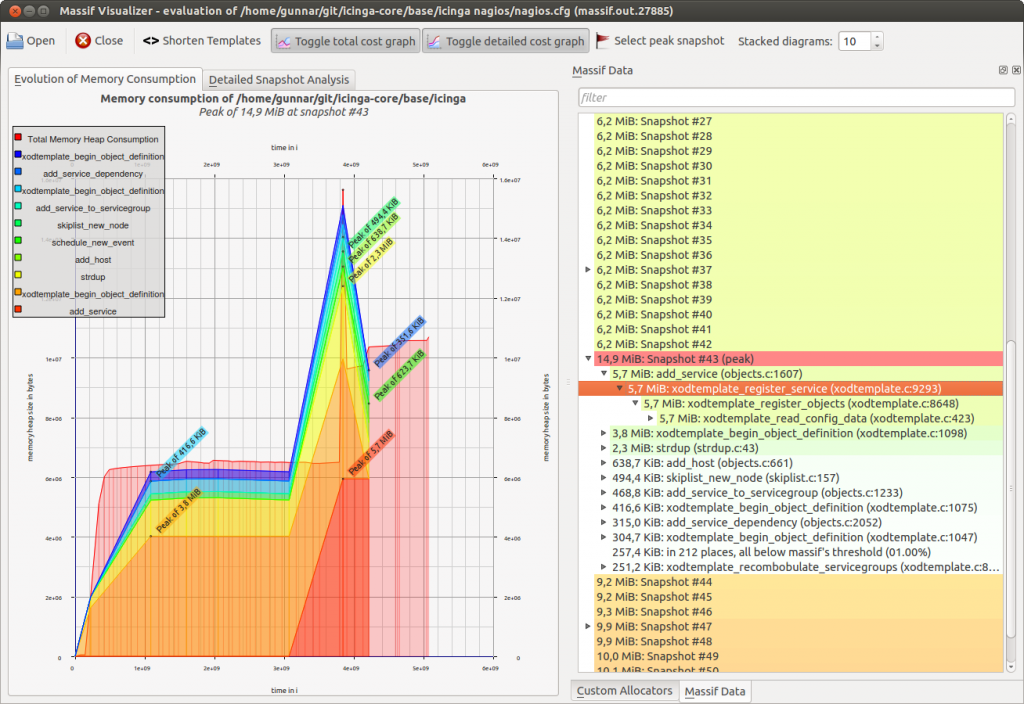
Massif schreibt die Profiling-Ergebnis in eine Datei mit dem Namen massif.out.<PID>. Wer das ganze etwas grafischer haben möchte, kann den Massif Visualizer verwenden (Paket: massif-visualizer):

Weekly Snap: Selenium, Jenkins & Valgrind Help, FLOSS UK & OSDC intensive workshops

19 – 23 March was packed with events – upcoming and bygone, international and local; tech advice from the development team and contributions from our consultants.
In a very international NETWAYS week, Marius and Eric headed off to the Ukraine to run an Icinga and InGraph training course for a client, while Bernd joined the FLOSS UK Spring Conference with a presentation on “Icinga at Deutsche Welle”. He also snapped up the opportunity to join a lively Puppet Camp in Edinburgh a day after.
Tobias then contemplated potential blog content for the future and Christoph introduced himself, his work and life out of the office.
Pamela shared our happy snaps from the recent CeBIT 2012 and reminded OSDC attendees to get their tickets for our intensive workshops on 24 April (conference eve).
Finally, from the development team, Ansgar offered some advice for common Selenium and Jenkins problems, while Gunnar offered his tip for finding memory leaks with Valgrind.

Memory-Leaks mit Valgrind finden

Wer in C Programme schreibt, weiss, wie schwierig es ist, per malloc() angeforderten Speicher wieder freizugeben. Allzu leicht vergisst man den entsprechenden free()-Aufruf, was dann zu Memory Leaks führt.
Solche Fehler per Hand zu finden, ist je nach Komplexität des Programms sehr schwierig. Glücklicherweise gibt es eine Reihe von Tools, die bei der Suche von Memory Leaks helfen.
Eines dieser Tools ist Valgrind. Neben Memory Leaks kann es auch eine ganze Reihe anderer Fehler finden (z.B. Buffer Overflows, Benutzung von nicht-initialisiertem Speicher, Benutzung von Speicher, nachdem dieser per free() wieder freigegeben wurde, und vieles mehr).
mehr lesen…