Modern cloud environments and microservice architectures need a changed mindset when it comes to monitoring. Classic host/service object relations are not always applicable, containers run in Kubernetes are short lived, and application performance within distributed networks is hard to monitor. Especially with applications running millions of operations, where to start the root cause analysis for slow client responses in your web shop? Is it just slow connections to MySQL, or does the application’s debug log slow down the entire fleet?
This is where observability with tracing comes into play. In the cloud native space, OpenTracing evolved as vendor neutral standardized API including client instrumentation. Famous tools are Zipkin and Jaeger which was contributed from Uber to the CNCF.
Let’s have a look into Jaeger today.
Getting Started
The easiest way to try Jaeger is with using the Docker container explained in the documentation.
docker run -d --name jaeger \
  -e COLLECTOR_ZIPKIN_HTTP_PORT=9411 \
  -p 5775:5775/udp \
  -p 6831:6831/udp \
  -p 6832:6832/udp \
  -p 5778:5778 \
  -p 16686:16686 \
  -p 14268:14268 \
  -p 9411:9411 \
  jaegertracing/all-in-one:1.16
Navigate to http://localhost:16686 to get greeted by Jaeger.
Try it
A sample application is available as container. I’m using a modified port mapping with 8081-8084 here since port 8080 is already assigned.
docker run --rm -it \
  --link jaeger \
  -p8081-8084:8080-8083 \
  -e JAEGER_AGENT_HOST="jaeger" \
  jaegertracing/example-hotrod:1.16 \
  all
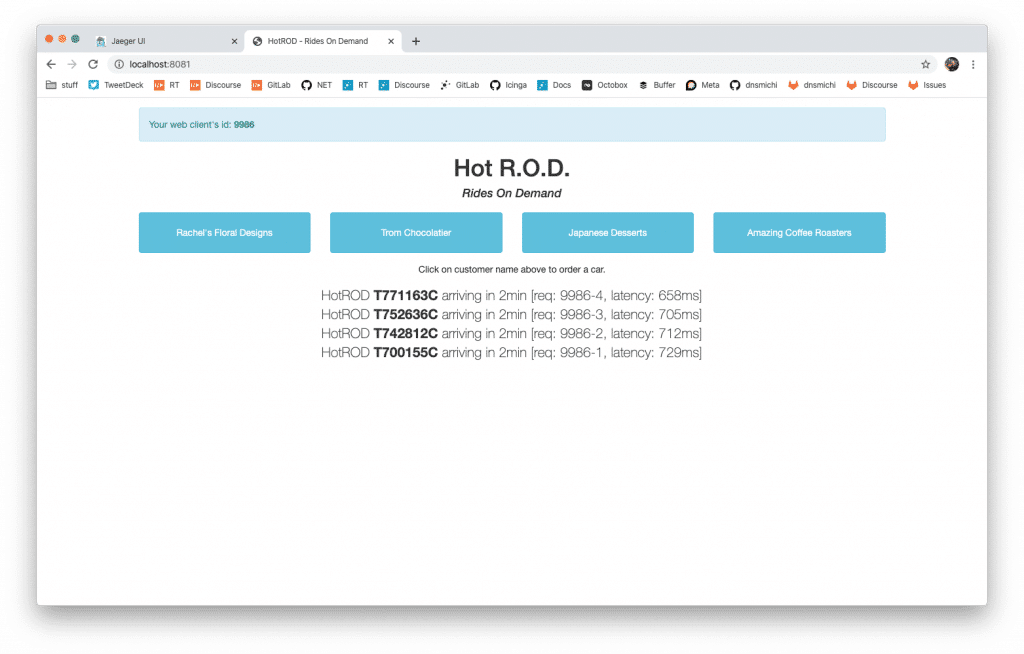
Navigate to http://localhost:8081 and click the buttons to order some cars.
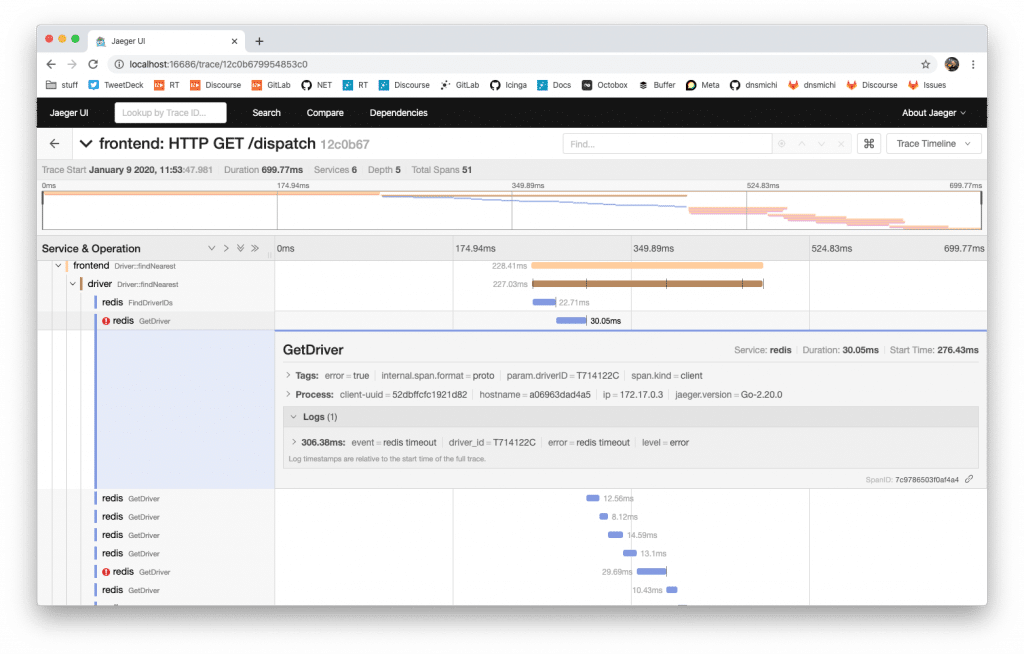
Within Jaeger itself, start analyzing the traces and for example learn that Redis runs into timeouts quite often delaying the HTTP responses to the clients.
Traces for applications
Jaeger provides officially supported client libraries for Go, Java, Python, NodeJS, C/C++, C#/.NET, others are in the making. Let’s see if we can add it into Icinga 2 and do some tracing here.
First off, clone the repository, build and install the client libraries. You’ll need CMake, a C++ compiler, etc. – basically everything which is required for Icinga 2 too and documented here. In this example, I’m compiling on my Macbook. There are additional libraries and headers required. Hint: Boost 1.72 has a bug which needs a patch.
brew install yaml-cpp thrift
git clone https://github.com/opentracing/opentracing-cpp && cd opentracing-cpp
# 1.6.0 doesn't work atm
git checkout v1.5.1
mkdir -p build && cd build
cmake ..
make && make install
cd ..
Then clone, cmake, make, install.
git clone https://github.com/jaegertracing/jaeger-client-cpp && cd jaeger-client-cpp
git checkout v0.5.0
# regenerate thrift headers for 0.11.0
find idl/thrift/ -type f -name \*.thrift -exec thrift -gen cpp -out src/jaegertracing/thrift-gen {} \;
mkdir -p build && cd build
cmake ..
make && make install
cd ..
In order to add Jaeger into Icinga 2, there are the following steps necessary:
- Add CMake functions to lookup yaml-cpp, opentracing, jaeger headers and libraries
- Optionally enable Jaeger tracing code, link the icinga2 binary against it
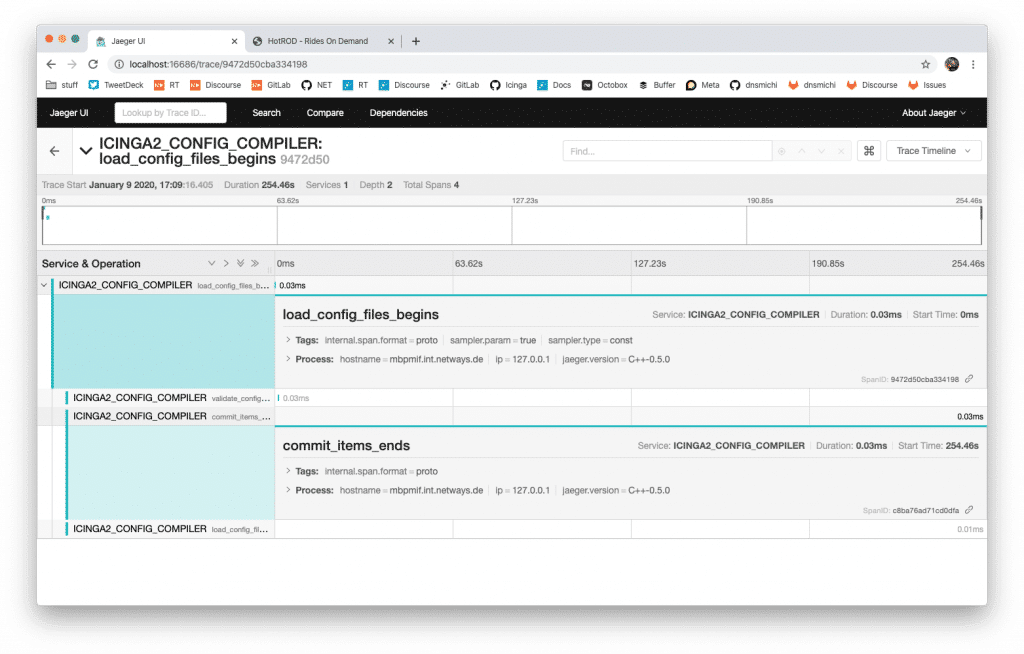
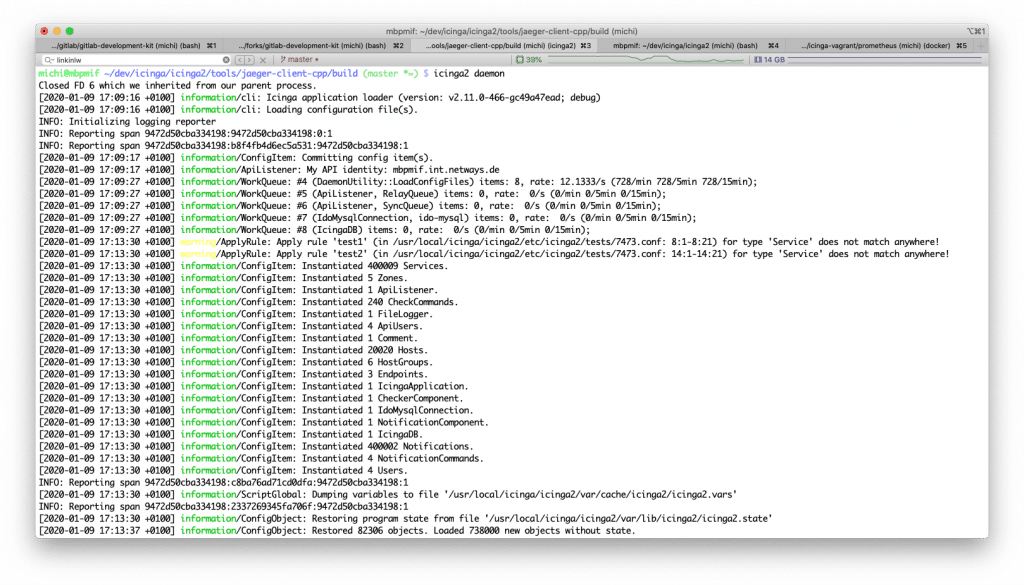
- Add a new tracer into the Config Compiler CLI command to measure the timing points
The majority of development time today was to resolve compile and linking issues, adding spans and traces is really simple. You can follow my progress in this Icinga PR – developers, get started wtih the client libraries and help your colleagues with enhanced observability!
Conclusion
Tracing application performance, cluster messages, end2end tests and any sort of event span provides valuable insights for both, devs and ops. With the new cloud native landscape evolving fast, we have additional possibilities to analyze our environments. Next to the now standardized tools for parsing and ingesting logs with Elastic Stack or Graylog, tracing has found its place in the observability stack.
Jaeger Tracing also is part of the GitLab observability suite which will be moved to the free core edition in 2020. Metrics, logging, alerts and tracing are key elements in modern cloud environments. Prometheus monitors everything from classic load checks to Kubernetes containers, Jaeger provides application performance insights and on top of that, Grafana combines the view on problems and trends. You can learn more about GitLab’s vision here.
Exploring these cool new features in GitLab are our mission in future trainings and workshops, watch this space in 2020!


