Seite wählen

NETWAYS Blog

Nagios Config Interfaces

Grafische Tools zur Konfiguration von Nagios und Icinga. Ein Thema – ein Dauerbrenner. So sehr diese Tools die Gruppe der Administratoren polarisiert, ist es doch oft unerlässlich sie einzusetzen. Sei es aufgrund unerfahrener Admins die mit Linux Systemen nicht vertraut sind oder eine Umgebung schlichtweg so groß und komplex geworden ist, das Schreiben und Pflegen von Config-Files Unmengen an Zeit verschlingt.
So haben wir uns Beispielsweise in einem aktuellen Großprojekt ebenfalls für ein grafisches Tool entschieden. Das geplante Endstadium (3.000 Hosts mit 45.000 Services auf aktuell 5 Icinga Clustern und Master-/Slave-Environment) ließ uns aber auch nahezu keine andere Wahl. Der Pflegeaufwand bei händischem Editieren wäre angesichts der vom Kunden prophezeiten Änderungs- und Wachstumsraten enorm.
In den nächsten Monaten möchte ich mich hin und wieder mit einem Tool befassen. Die aktuelle Auswahl besteht aus:

  • LConf
  • NConf
  • Lilac
  • NagiosQL
  • NagiosAdministrator

Zu prüfende Kriterien sind:

  • Installationsvoraussetzungen – Wie schwierig ist die Installation? Was wird alles benötigt?
  • Handling / Usability – Wie kann ich konfigurieren? Wie benutzerfreundlich ist es?
  • Funktionsumfang – Was wird unterstützt? Was wird nicht unterstützt?
  • Enterprise Environments – Mehrere Instanzen? Master / Slave Umgebungen?
  • Datenimport – Kann ich meine bestehende Konfiguration beibehalten?
  • Sonstiges – Raum für sonstige, positiv aufgefallene Features

Weitere Wünsche zu Tools und Test-Kriterien sind jederzeit willkommen.
Viel Spaß!

Tobias Redel
Tobias Redel
Head of Professional Services

Tobias hat nach seiner Ausbildung als Fachinformatiker bei der Deutschen Telekom bei T-Systems gearbeitet. Seit August 2008 ist er bei NETWAYS, wo er in der Consulting-Truppe unsere Kunden in Sachen Open Source, Monitoring und Systems Management unterstützt. Insgeheim führt er jedoch ein Doppelleben als Travel-Hacker und renoviert, baut und bastelt als Heimwerker an allem was er finden kann.

Jasper Reporting – Zusammenfassung

Jasper-ReportingIn den letzten Wochen habe ich mich an dieser Stelle ausführlich mit Jasper-Report beschäftigt. Da wir Jasper stark zunehmend in unseren Kundenprojekten einsetzen auch im Bereich Managed Service  darauf zurückgreifen, lag die Serie sehr nah und ich hoffe soweit die wichtigsten Kernaspekte getroffen zu haben.
Hier nochmals die verschiedenen Posts zum Thema im Überblick:

An dieser Stelle Danke für das positive Feedback und dem starken Interesse an der Serie und dem Thema Reporting. Hier sei auch nochmals auf die NETWAYS Reports auf netways.org hingewiesen. Sollten Fragen offen geblieben sein, so freue ich mich über Kommentare oder Gespräche auf der Open Source Monitoring Conference nächste Woche.
Alle Beispielreports befinden sich auch auf dem Demo-System und können dort gegen unser Nagios-Demo-System gestartet werden.

Bernd Erk
Bernd Erk
CEO

Bernd ist Geschäftsführer der NETWAYS Gruppe und verantwortet die Strategie und das Tagesgeschäft. Bei NETWAYS kümmert er sich eigentlich um alles, was andere nicht machen wollen oder können (meistens eher wollen). Darüber hinaus startete er früher das wöchentliche Lexware-Backup, welches er nun endlich automatisiert hat. So investiert er seine ganze Energie in den Rest der Truppe und versucht für kollektives Glück zu sorgen. In seiner Freizeit macht er mit sinnlosen Ideen seine Frau verrückt und verbündet sich dafür mit seinen beiden Söhnen und seiner Tochter.

Ask the developer: NagiosGrapher


What is NagiosGrapher?
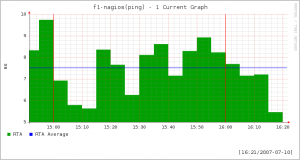
NagiosGrapher is a Nagios add on which automatically generates performance charts and graphs from returned Nagios values. It takes the raw Nagios data and turns it into normalised values administrators can analyse, either on its own or Nagios’ web interface.
NagiosGrapher and NETWAYSGrapherV2 – what’s the difference?
They use a completely different architecture. NagiosGrapher is the predecessor to NETWAYSGrapherV2, but as it is so popular in the community, we decided to keep the project running. We’ve invested the latest technologies in the NETWAYSGrapherV2 however, and that is our main ‘grapher’ project.
How does it work?
Nagios plugins run checks on hosts and services, returning results in strings of extended information. The NagiosGrapher daemon receives these via perf-files or a pipe, filters them of numeric data by using regular expressions  and stores the data in a RRD (Round Robin Database). The functions we built use the RRD to create graphs from the data values and are generated on request – in real-time (or within 5 min). All interaction can be made on a Perl CGI based front end, or through the Nagios system itself.
Any interesting features?multigraphs
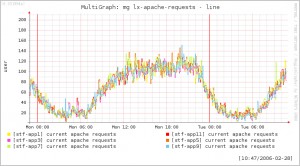
Aside from the real-time graphing as mentioned above, NagiosGrapher also does ‘Mulit-graphs’. Several different graphs can be brought together and displayed in one view, which is quite handy when analysing multiple switch ports for example.
NagiosGrapher also features a ‘process-service-perfdata’ interface, so no patches or changes to the Nagios system needs to be made. This ensures that it is easy to install and maintain. Unlike some other programs, you don’t need to repeat installations because it automatically recognises new devices and services, incorporating their monitoring values for graphing. And because it runs on RRD with automated data cleanup, the database stays at a fixed size, keeping the backend slim.

What is the ‘process-service-perfdata’ interface exactly?

This is an extra specialised interface between Nagios and the RRD where the returned Nagios performance values are normalised. Because it acts as a kind of translation device, no patches or alterations need to be made to Nagios itself, making installation and operation much smoother.
f1-nagios_ping_1currentHow does it compare to other graphing tools?
NagiosGrapher is one of the most popular, longstanding graphing tools for Nagios, alongside nagiosgraph and PnP. Where PnP is easier and faster to configure, it only reads perfdata. NagiosGrapher is more complex but can check older plugin output, and breaks into components easily, thus being also more flexible. This makes it fantastic to scale and implement in large environments.
Any plans for further developments?
NagiosGrapher has been around for quite a while now, but at least it’s reliably stable and very robust. Basically, we’ll keep with maintenance and patches but really our main development work is on the NETWAYSGrapherV2 – speaking of which, we have just released the RC1.
NagiosGrapher in a nutshell?
The old-timer basic Grapher for reliable performance charts, easy to install, easy to maintain and good for large environments – but not as dynamic as the new NETWAYSGrapherV2!
More information:
Join the project or download

Ask the developer: NETWAYSGrapherV2

What is NETWAYSGrapherV2?
NETWAYSGrapherV2 is the newest graphing addon for Nagios and any other software. It plots charts and graphs automatically from returned Nagios plugin output, so administrators can make performance analyses of their network and applications easier.

How does it work?
Plugin output, perf data, PIPE interface and TCP protocol from any software such as Nagios are received by a collector daemon. Here the data is parsed to filter out numeric values automatically, which are then sent to the MySQL database. When a user requests a graph on the web interface front end, the Grapher API retrieves data from the database and creates graphs though the charting engine developed on Adobe Flex.

Why Adobe Flex?AdobeFlex Graphs - mouseover
Adobe Flex is very powerful tool for graphing – it allows us to create “real” real time graphs, where the user can watch the chart change with the flow of data. It allows the user to mouse over individual time points to get specifics.

What’s different about this grapher?
Aside from the “real” real time charts, the dashboards and automated housekeeping are pretty exclusive.
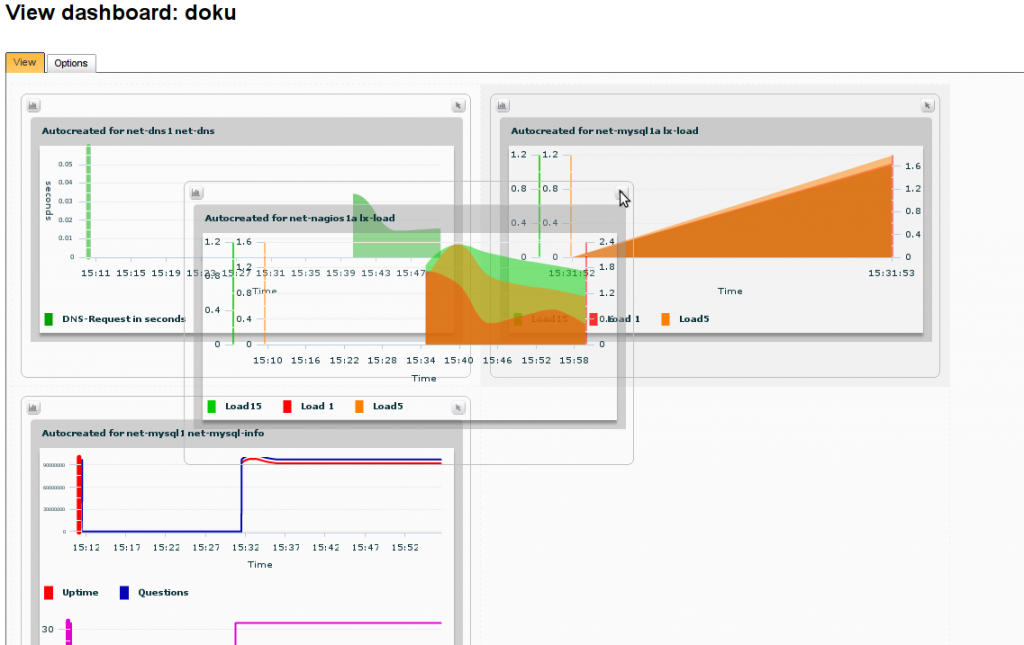
Dashboards allow the user to set multiple graphs they need for their daily tasks onto one ‘screen set’ for easy viewing – which can be shared with other users too.
The collected data is automatically aggregated in to hourly, weekly, monthly or yearly sets in an ongoing housekeeping in the background so they can be easily called up later for graphing.dashboard
How does it compare to other graphing tools?
Nothing compares to it when it comes to handling, display and useability – nothing that we have seen out there so far.
What about useability?
Well, there are a few user friendly features such as the ‘drag & drop’ multi-graphs, Ajax search, and different display methods with navigation toggle and full view functions.
With the ‘drag & drop’ multi-graphs, the user can compare for example the bandwidths of two machines by simply clicking on one chart and dropping it on the other.
Also, users can essentially manage themselves because all user and user group management is done through the web interface. That’s really handy for larger companies with many administrators or for managed services companies to offer customers views of their Nagios systems.
Do you have a favourite feature or tool?
The new collector daemon is cool and took a lot of work – it automatically filters values out of the plugin or perfdata without the user needing to code a thing.
And then of course the Adobe Flex charts – it’s simply the new way to display graphs.Multigraphs - drag & drop
What’s the outlook?
We believe management should be kept simple – so we want to reduce the amount of manual back end work the user has to do, by making everything accessible through simply clicking on the web interface. That, and speed up the performance of the collector – there’s always room to improve!
NETWAYSGrapherV2 in a nutshell?
It’s really the next generation grapher – genuinely real time, flexible and user friendly to a click.
More information:
Join the project or download

Ask the developer: NoMa for Nagios

What is NoMa?
Short for Notification Manager, it is an online tool for managing contacts and the Nagios notifications they receive. It offers easy administration of contacts, groups and escalations, taking into account working hours, time zones and even holidays.


Who is NoMa useful for?

NoMa is great for environments which have many contacts, hosts, services etc., and whose contacts should receive different notifications. If I could create a ‘Nagios Enterprise Suite’ for data centers, large and international corporations- then NoMa would definitely be in there.
How does it work?
NoMa on its own is simply consists of a MySQL database, lookup scripts and notification scripts, and the whole thing is connected to Nagios as a normal plugin.

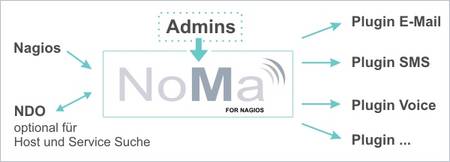
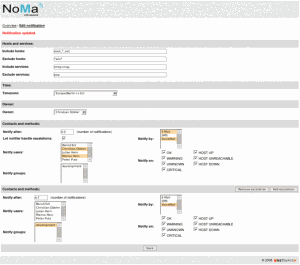
The user enters contacts, groups and their respective notification requirements via the online interface to be stored in the database. In entering notification requirements, NoMa queries the NDO and gives an Ajax search preview.

When Nagios registers an error, it notifies NoMa. Then NoMa looks up the notification, contact, escalation level, dates or times and alert methods that match, and forwards the Nagios alert to the right person or people. All sent notifications then are available on a log viewer.
In essence we have outsourced the notifications component of Nagios to NoMa.

What communication channels can be used?

Any! The NoMa download comes with notification scripts for email, voicemail and SMS. The great thing about NoMa is that it is easily extendable – I imagine that an IM script exists somewhere already.
How is NoMa’s user administration?
NoMa has really flexible access management system, avoiding the glitch so many softwares have, that only one single administrator has access rights. Multiple users can edit notifications, but it is also easily customised to enable for example, low level administrators the chance to edit their own or group’s notification details, but nothing else.
What’s cool about NoMa?
The use of wildcard characters to define hosts and services for notification recipients – not only can the user search hosts and services by typing the first few letters to call up a list of matches, but they can also define them with wildcards for configuration. NoMa can essentially find and configure notifications from an unlimited number of hosts and services, without the administrator needing to know their names. Even better, you can search and define on multiple terms and make exclusions all in one hit. Just wildcard definitions alone make NoMa incredibly useful for large environments.

NoMa in a nutshell?

Basically NoMa makes sure that the right notifications go to the right people at the right times – but instead of typing in config files, you can do it all through a few clicks on NoMa. It makes life easier, taking the ‘manual work’ out of configuring notifications in Nagios. Easy admin for the admins!
More information:
Features & demo system
Join the project or download