Seite wählen

NETWAYS Blog

Documentation matters or why OSMC made me write NSClient++ API docs

Last year I learned about the new HTTP API in NSClient++. I stumbled over it in a blog post with some details, but there were no docs. Instant thought „a software without docs is crap, throw it away“. I am a developer myself, and I know how hard it is to put your code and features into the right shape. And I am all for Open Source, so why not read the source code and reverse engineer the features.
I’ve found out many things, and decided to write a blog post about it. I just had no time, and the old NSClient++ documentation was written in ASCIIDoc. A format which isn’t easy to write, and requires a whole lot knowledge to format and generate readable previews. I skipped it, but I eagerly wanted to have API documentation. Not only for me when I want to look into NSClient++ API queries, but also for anyone out there.
 

Join the conversation

I met Michael at OSMC 2016 again, and we somehow managed to talk about NSClient++. „The development environment is tricky to setup“, I told him, „and I struggle with writing documentation patches in asciidoc.“. We especially talked about the API parts of the documentation I wanted to contribute.
So we made a deal: If I would write documentation for the NSClient++ API, Michael will go for Markdown as documentation format and convert everything else. Michael was way too fast in December and greeted me with shiny Markdown. I wasn’t ready for it, and time goes by. Lately I have been reviewing Jean’s check_nscp_api plugin to finally release it in Icinga 2 v2.7. And so I looked into NSClient++, its API and my longstanding TODO again.
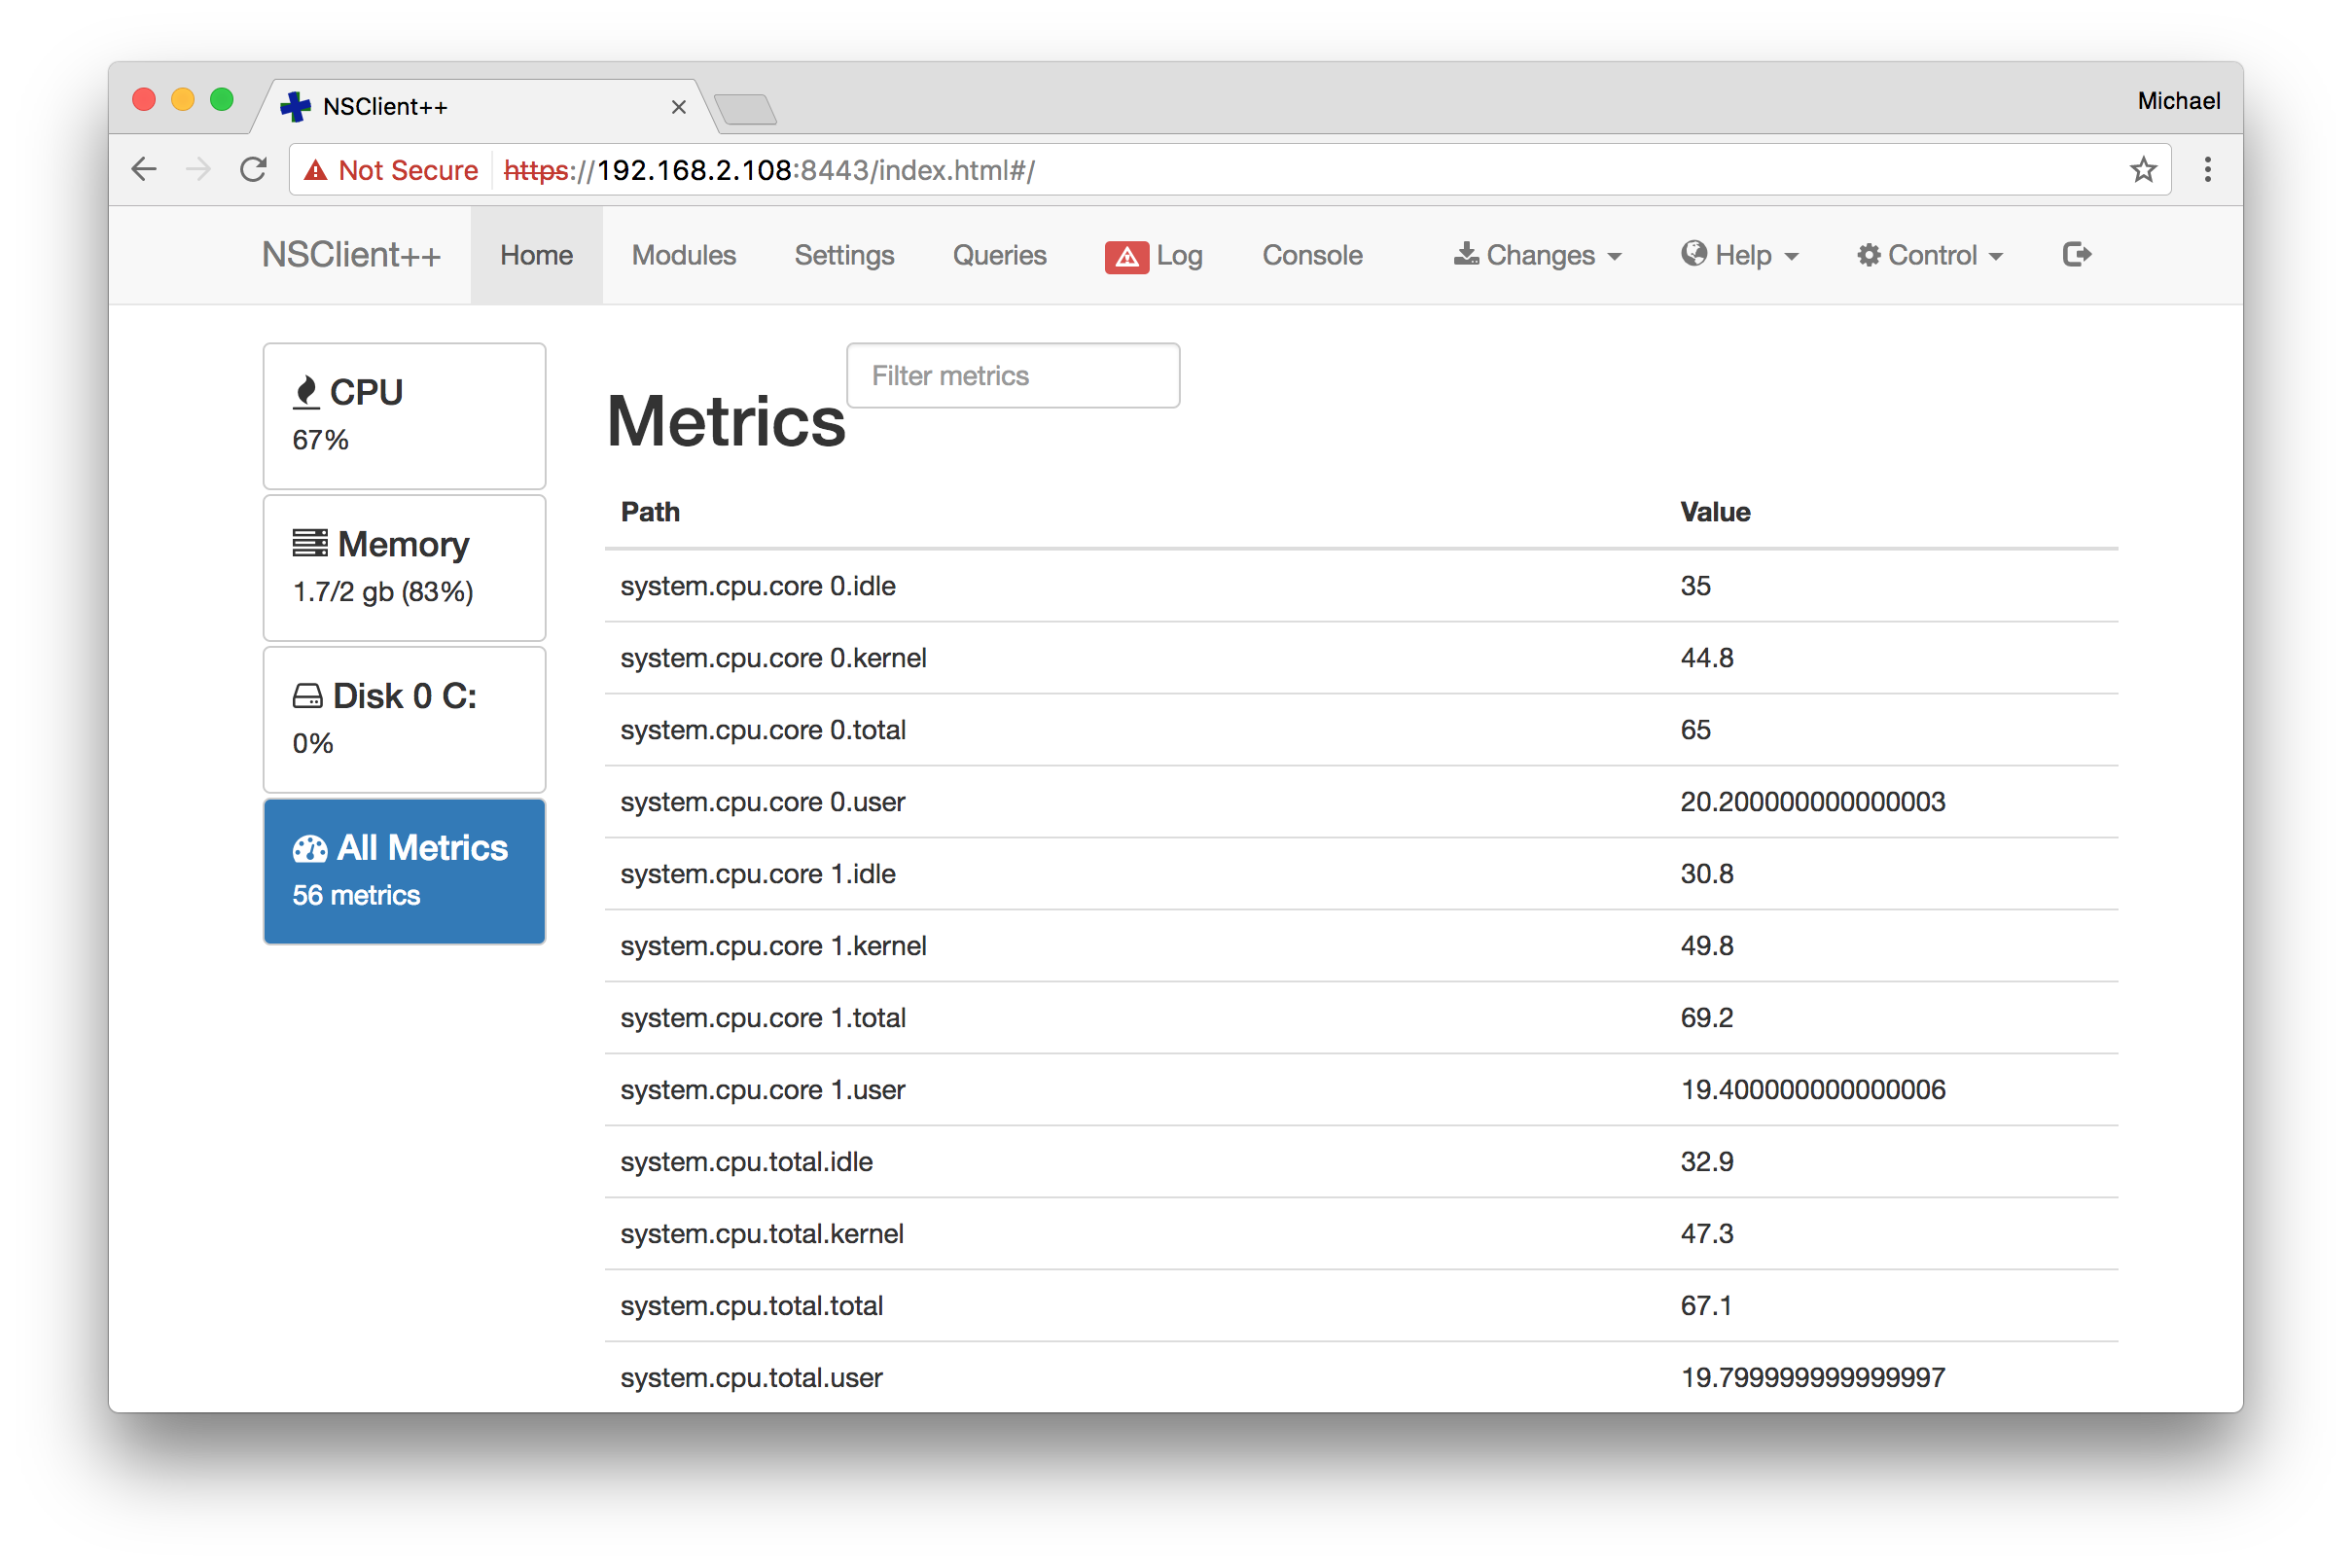
Documentation provides facts and ideally you can walk from top to down, and an API provides so many things to tell. The NSClient API has a bonus: It renders a web interface in your browser too. While thinking about the documentation structure, I could play around with the queries, online configuration and what not.
 

Write and test documentation

Markdown is a markup language. You’ll not only put static text into it, but also use certain patterns and structures to render it in a beautiful representation, just like HTML.
A common approach to render Markdown is seen on GitHub who enriched the original specification and created „GitHub flavoured Markdown„. You can easily edit the documentation online on GitHub and render a preview. Once work is done, you send a pull request in couple of clicks. Very easy 🙂


If you are planning to write a massive amount of documentation with many images added, a local checkout of the git repository and your favourite editor comes in handy. vim handles markdown syntax highlighting already. If you have seen GitHub’s Atom editor, you probably know it has many plugins and features. One of them is to highlight Markdown syntax and to provide a live preview. If you want to do it in your browser, switch to dillinger.io.

NSClient++ uses MKDocs for rendering and building docs. You can start an mkdocs instance locally and test your edits „live“, as you would see them on https://docs.nsclient.org.

Since you always need someone who guides you, the first PR I sent over to Michael was exactly to highlight MKDocs inside the README.md 🙂
 

Already have a solution in mind?

Open the documentation and enhance it. Fix a typo even and help the developers and community members. Don’t move into blaming the developer, that just makes you feel bad. Don’t just wait until someone else will fix it. Not many people love to write documentation.
I kept writing blog posts and wiki articles as my own documentation for things I found over the years. I once stopped with GitHub and Markdown and decided to push my knowledge upstream. Every time I visit the Grafana module for Icinga Web 2 for example, I can use the docs to copy paste configs. Guess what my first contribution to this community project was? 🙂
I gave my word to Michael, and you’ll see how easy it is to write docs for NSClient++ – PR #4.


Lessions learned

Documentation is different from writing a book or an article in a magazine. Take the Icinga 2 book as an example: It provides many hints, hides unnecessary facts and pushes you into a story about a company and which services to monitor. This is more focussed on the problem the reader will be solving. That does not mean that pure documentation can’t be easy to read, but still it requires more attention and your desire to try things.
You can extend the knowledge from reading documentation by moving into training sessions or workshops. It’s a good feeling when you discuss the things you’ve just learned at, or having a G&T in the evening. A special flow – which I cannot really describe – happens during OSMC workshops and hackathons or at an Icinga Camp near you. I always have the feeling that I’ve solved so many questions in so little time. That’s more than I could ever write into a documentation chapter or into a thread over at monitoring-portal.org 🙂
Still, I love to write and enhance documentation. This is the initial kickoff for any howto, training or workshop which might follow. We’re making our life so much easier when things are not asked five times, but they’re visible and available as URL somewhere. I’d like to encourage everyone out there to feel the same about documentation.
 

Conclusion

Ever thought about „ah, that is missing“ and then forgot to tell anyone? Practice a little and get used to GitHub documentation edits, Atom, vim, MkDocs. Adopt that into your workflow and give something back to your open source project heroes. Marianne is doing great with Icinga 2 documentation already! Once your patch gets merged, that’s pure energy, I tell you 🙂
I’m looking forward to meet Michael at OSMC 2017 again and we will have a G&T together for sure. Oh, Michael, btw – you still need to join your Call for Papers. Could it be something about the API with a link to the newly written docs in the slides please? 🙂
PS: Ask my colleagues here at NETWAYS about customer documentation I keep writing. It simply avoids to explain every little detail in mails, tickets and whatnot. Reduce the stress level and make everyone happy with awesome documentation. That’s my spirit 🙂

Windows performance counters with NSClient++ and Graphite

Windows performance counters have been there for ages. While modern interfaces such as WMI attempt to replace performance counters they still provide access to unique metrics. Fetching performance counters through NSClient++ is helped with the check_pdh query.
We’ve had an interesting issue with performance counters being received from a Windows client and then written to  Graphite. The involved components in this setup are

  • Icinga 2 as master
  • GraphiteWriter feature enabled and Graphite running
  • An Icinga 2 client on the windows machine checked via cluster config sync
  • nscp-local“ CheckCommand objects for querying nscp.exe directly (config sync, global zone)
  • NSClient++ installed on the Windows client


The Problem

perfcounter_errorGraphite Web refuses to display any value for that metric as seen in the screenshot. A similar problem is discussed at the monitoring portal (German).
While further analysing the problem we’ve come around this blog post. It did not help resolve the problem but provided insights on the problem within Graphite itself.
The culprit lies in the performance data label containing the „%“ character. You will encounter similar issue with the „*“ character. The filesystem does not allow to store and load these files.
There’s an issue on the Graphite bug tracker which targets dealing with special characters and better error handling.
 

The Solution

It may sound reasonable to remove such strings in the Carbon Cache backend, or use a shell wrapper for calling the nscp.exe and reformatting the returned metrics. Though those are just workarounds for the real issue.
perfcounter_fixedAt first glance we looked into perf-config but that only allows to modify the performance data label suffix. The documentation is still a TODO so it was more or less reading the source code and figuring out what other options are available.
In the end it turned out to be far more easy – Michael Medin, you’re a genius – perf-syntax provides the ability to just format your metrics as plugin performance data for your likings. The following example overrides the counter label to „Processor Time“ – Graphite works again!

C:\Program Files (x86)\NSClient++>nscp.exe client --load-all --log info -b -q check_pdh counter="\Processor(_Total)\% Processor Time" perf-syntax="Processor Time"
11:02 OK: \Processor(_Total)\% Processor Time = 0|'Processor Time_value'=0;0;0


Icinga 2 Integration

The nscp-local CheckCommand definitions must be included by editing the icinga2.conf file on both the master and the client.

include <nscp-local>

If you prefer to use your own CheckCommand definition ensure to deploy it using a global zone defined on both the master and the client.
CheckCommand example:

object CheckCommand "nscp-local-pdh" {
        import  "nscp-local"
        arguments += {
            "counter" = {
                value = "counter=$pdh_counter$"
                required = true
                skip_key = true
            }
            crit = {
                value = "crit=value > $pdh_crit$"
                skip_key = true
            }
            warn = {
                value = "warn=value > $pdh_warn$"
                skip_key = true
            }
            "perf-syntax" = {
                 value = "perf-syntax=$pdh_perfsyntax$"
                 skip_key = true
            }
        }
        vars.nscp_query = "check_pdh"
        vars.pdh_perfsyntax = "$pdh_counter$"
}

Service apply example (via cluster config sync):

apply Service "perfcounter_test" {
    import "generic-service"
    check_command = "nscp-local-pdh"
    vars.pdh_counter = "\\Processor(_total)\\% Processor Time"
    vars.pdh_perfsyntax = "Total Processor Time"
    vars.pdh_warn = "1"
    vars.pdh_crit = "5"
    assign where host.address
}

 
I’ve created an Icinga 2 issue for extending the Icinga 2 NSCP CheckCommands to provide the perf-config and perf-syntax natively.
 

More Hints

NSClient++ 0.4.2 changed the performance data label for counters and added the „_value“ suffix. More recent versions allowed to override the suffix by defining the perf-config attribute. Although there is a bug which does not allow to remove the suffix. This should be fixed in the most recent stable release.

perf-config=*(suffix:none)


Conclusion

A tricky problem which probably affects a lot of users. A benefit of Open Source development – read the source, Luke 🙂
read_the_source_luke
(Copyright by http://blog.codinghorror.com/learn-to-read-the-source-luke/)

Guest Post by Michael Medin: Why OSMC is the best conference

Now my story begin, as it so often does, in a dungeon by accident (don’t ask). Unlike many other stories involving dungeons this one does not feature dragons, instead we find ourselves in a posh conference venue in an abandoned bomb shelter if memory serves correctly. I was there as I got the opportunity to talk about NSClient++ at a rather small conference in Sweden. This was supposed to be the height of my career as a hobby open source developer. After my presentation, which presumably went ok, I was greeted by a rather towering presence who introduced himself as Bernd and asked if I wanted to talk at their conference in Germany. As I was still cruising the residual adrenalin wave I almost instantly shouted „YES!“ Pretty much without thinking (unfortunately I do that a lot).
After saying yes I kind of realised that in Germany they don’t speak Swedish
So I added something lame about google translate but they assured me that I could do it all in English. The day went on and after attending the evening event (where we got the usual 2 complimentary beers) I walked home towards the commuter train slightly drunk on beer but even more so on adrenalin.

I thought to myself: WOW, rock star! This is going to be awesome…

As the buzz slowly settled into a sizable hangover I realised that: what at the time had seemed like an o-wondrous and a grand adventure slowly translated into countless hours of writing code so I could present something as well as even more countless hours preparing a presentation followed by more countless hours rehearsing followed by paying for a plane ticket a few hotel nights, train tickets and a bunch of other expenses… So grand experience might be a bit of grand term… Perhaps stupidest idea ever would have been better. On the flight down panic started to set it… What if none one shows up… what if…
So how was my first OSMC all those years ago?
To be honest I can barely recall it, what I do recall is that I needed to wee 5 times before my session as well as the open bar they had at the evening event. This was a first for me given the alcohol policy in Sweden… but anyways I digress…
So why is OSMC the best conference ever?
Well in all honesty it probably isn’t… But OSMC has gotten a lot of things just right which not all conference manage to pull off. But the biggest thing about OSMC which I cannot say about many other conferences it that it has a true sense of family about it. Much like you imagine thanksgiving or X-mas to be. Warm fuzzy and cosy, something to long for…
So what has they got right you ask? Well it’s really boils down to balance. It’s small enough that everyone still have names, yet hard core enough that everyone really care about monitoring.
It is relevant enough that everyone wants to be there yet prestigeless enough to let anyone talk. They allow the big projects equal space to the small ones. And this balance is really hard to pull off. So OSMC really manages to live somewhere in the middle and really deliver quality year after year…
Every year I always feel I learn plenty of new things. Now that could of course be my ignorance shining through but I think it is that the conference stay close to its heart: to be open and to really care about monitoring. Everyone is welcome, every project gets equal focus and there is no hidden agenda…
Last year I had one of those rare moments where sitting having a beer and an chatting after the conference I find sitting across from me in the same sofa representatives from Icinga, Opennms and Zabbix
Now not only is this where the next generation monitoring tools are forged… It is also very very nice…
…and more importantly: where else in the world will you find that?


The Author Michael Medin
csm_speaker_michael_medin_150x100_0f144aff65
Michael Medin is a Senior Architect and open source developer and has (among other things) written the de-facto agent for monitoring (among other things) Windows-based servers from (among other things) Nagios (NSClient++). In his not-so-spare time he works as a consultant building middleware on mainly Oracle using Java, XML and various Web Service and REST technologies. When he is not working diligently at his computer he is often found riding his mountain bike along some rocky single track in the glorious Swedish countryside.


Bernd Erk
Bernd Erk
CEO

Bernd ist Geschäftsführer der NETWAYS Gruppe und verantwortet die Strategie und das Tagesgeschäft. Bei NETWAYS kümmert er sich eigentlich um alles, was andere nicht machen wollen oder können (meistens eher wollen). Darüber hinaus startete er früher das wöchentliche Lexware-Backup, welches er nun endlich automatisiert hat. So investiert er seine ganze Energie in den Rest der Truppe und versucht für kollektives Glück zu sorgen. In seiner Freizeit macht er mit sinnlosen Ideen seine Frau verrückt und verbündet sich dafür mit seinen beiden Söhnen und seiner Tochter.

NSClient++ und darüber hinaus

nsclient-logoFür viele verschiedene Anwendungsgebiete bringt NSClient++ schon Funktionen mit, mit Hilfe derer man direkt und ohne Probleme Dinge wie Festplattenauslastung, CPU, Memory, Services und Logs abfragen kann.
Heute soll es einmal um die Themen gehen, die der NSClient nicht „out of the box“ beherrscht.  Vor allem im Bereich der Client Überwachung gibt es hier noch ungenutztes Potential:

1.) Security Center

Mit Hilfe von WMI ist es auf einfache Weise möglich auf Windows Clients ab Vista zu überprüfen wie der Antivirus Status ist. Hierfür gibt es einen namespace „root\SecurityCenter2“ mit der Klasse AntiVirusProduct. Hier kann man den Schlüssel ProductState überprüfen. Die Interpretation dieses Wertes ist nun leider nicht durchgängig Dokumentiert und sollte gegen das eigene Antivirus Produkt nochmal gegen geprüft werden.
Folgende Artikel können hierbei hilfreich sein:

  • http://neophob.com/2010/03/wmi-query-windows-securitycenter2/
  • Microsoft Blog

2.) Windows Updates

Hierfür gibt es ein Powershell Plugin, dass einem beantwortet ob Updates anstehen oder ein reboot seiner Durchführung harrt. Da es mit dem Original Plugin von Jules ein paar bekannte Performance Probleme gibt empfehle ich hier die verbesserte Version von redbranch[Jonny]

3.) GPO – Gruppenrichtlinien

Bei den Gruppenrichtlinien handelt es sich um ein Server/Client basiertes System zur Verteilung von Windows Konfigurationsobjekten. Auf dem Client sollte man daher überprüfen, ob der Service zur Umsetzung dieser Konfigurationsanweisungen überhaupt läuft. Das lässt sich bequem mit dem NSClient++ erreichen indem man den Service „gpsvc“ überprüft. Ob wirklich alle Richtlinien umgesetzt wurden kann man am besten auf dem Server überprüfen. Dazu im nächsten Teil der Serie mehr.

WMI reparieren

Sollte es einmal Probleme mit dem Windows Management Intrumentarium geben und man weiß nicht wie dieses zu reparieren ist, sollte man sich mal das Diagnose- und Repair-Tool von Microsoft hierfür anschauen.
 
Im nächsten Teil dieser Serie geht es um Advanced Windows Server Monitoring. Insbesondere wird es hierbei um GPOs und Windows Updates aus der Sicht der Servers gehen.

Christoph Niemann
Christoph Niemann
Senior Consultant

Christoph hat bei uns im Bereich Managed Service begonnen und sich dort intensiv mit dem internen Monitoring auseinandergesetzt. Seit 2011 ist er nun im Consulting aktiv und unterstützt unsere Kunden vor Ort bei größeren Monitoring-Projekten und PERL-Developer-Hells.

Ab auf die Alm!

kempten-logo-printIch hatte neulich das vergnügen zwei Wochen im sonnigen Kempten bei der Stadtverwaltung zu verbringen und dort die Migration von Icinga 1 auf Icinga 2 zu begleiten. Die neue Icinga 2 Umgebung setzt fast ausschließlich auf den neuen Icinga 2 Agent. Dieser bietet zwischen Server und Agent eine TLS verschlüsselte, persistente und zertifikatsbasierte authentifizierte Verbindung und damit ein Höchstmaß an Sicherheit. Der Verbindungsaufbau kann in beide Richtungen erfolgen. Auf Linux-Servern werden die Monitoring-Plugins lokal über den Agent ausgeführt, auf Windows-Servern die NSClient++ Plugins über NSCP-Aufrufe. Einige alte, mit Icinga 2 nicht kompatible, noch im Einsatz befindliche Windows 2003 Server werden bis zu ihrer Ablösung noch über den NSClient++ NRPR-Server überwacht.

Lennart Betz
Lennart Betz
Senior Consultant

Der diplomierte Mathematiker arbeitet bei NETWAYS im Bereich Consulting und bereichert seine Kunden mit seinem Wissen zu Icinga, Nagios und anderen Open Source Administrationstools. Im Büro erleuchtet Lennart seine Kollegen mit fundierten geschichtlichen Vorträgen die seinesgleichen suchen.