Seite wählen

NETWAYS Blog

Vagrant box playtime

vagrant_icingaweb2_dashboardWhile preparing for the Icinga OSMC booth and talk, the Icinga developers thought about enhancing the existing Vagrant boxes and include more demo cases. While the icinga2x-cluster boxes illustrate the cluster in a master-checker setup, the standalone box icinga2x focuses on a single Icinga 2 instance with Icinga Web 2 and the Icinga 2 API.
Alongside the Icinga 2 API and Icinga Web 2 there are numerous additions to the icinga2x Vagrant box:
 

PNP
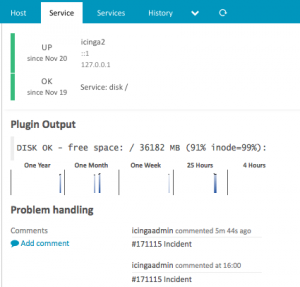
vagrant_icinaweb2_detail_graphs_ttsPNP4Nagios is installed from the EPEL repository. The Icinga 2 Perfdata feature ensures that performance data files are written and the NPCD daemon updates the RRD files. Navigate to the host or service detail in Icinga Web 2 and watch the beautiful graphs. There’s also a menu entry in Icinga Web 2 providing an iframe to the PNP web frontend on its own.
 

GenericTTS

There are demo comments including a ticket id inside the Vagrant box. A simple script feeds them into the Icinga 2 API and the Icinga Web 2 module takes care of parsing the regex and adding a URL for demo purposes.
 

Business Process
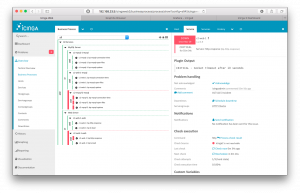
vagrant_icingaweb2_business_processThe box provides 2 use cases for a business process demo: web services and mysql services. In order to check the MySQL database serving DB IDO and Icinga Web 2, the check_mysql_health plugin is used (Icinga 2 v2.4 also provides a CheckCommand inside the ITL <plugins-contrib> already, so integration is a breeze).
These Icinga 2 checks come configured as Business Processes in the Icinga Web 2 module which also allows you to change and simulate certain failure scenarios. You’ll also recognise a dashboard item for the Top Level View allowing you to easily navigate into the BP tree and the host and service details. Pretty cool, eh?
 

NagVis

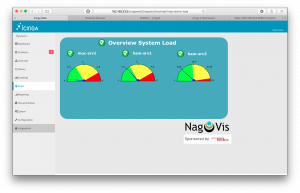
vagrant_icingaweb2_nagvis
The puppet module installs the latest stable NagVis release and configures the DB IDO as backend. The integration into Icinga Web 2 uses a newly developed module providing a more complete style and integrated authentication for the NagVis backend. Though there are no custom dashboards yet – send in a patch if you have some cool ones 🙂
 

Graphite

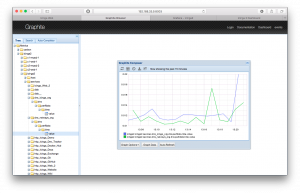
vagrant_graphite_web
The Graphite backend installation is helped with Puppet modules, the main difference is that Graphite Web VHost is listening on port 8003 by default (80 is reserved for Icinga Web 2). The carbon cache daemon is listening on 2003 where the Icinga 2 Graphite feature is writing the metrics to.


Grafana

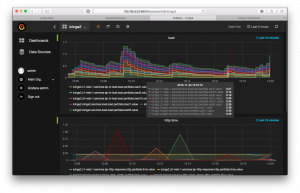
vagrant_grafana
Grafana 2 uses Graphite Web as datasource. It comes preconfigured with the Icinga 2 dashboard providing an overview on load, http, mysql metrics and allows you to easily modify or add new graphs to your dashboard(s).
 

Dashing

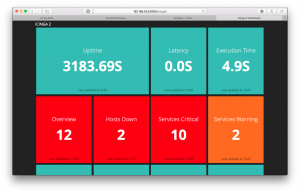
vagrant_dashing
There was a Dashing demo using the Icinga 2 API at Icinga Camp Portland though it required some manual installation steps. Since the Vagrant box already enabled the Icinga 2 API, the provisioner now also installs Dashing and the demo files. Note: Installing the Ruby gems required for Dashing might take a while depending on your internet connection. If Dashing is not running, call `restart-dashing`.
 

Playtime!

The icinga2x box requires a little more resources so make sure to have 2 cpu cores and 2 GB RAM available. You’ll need Vagrant and Virtualbox or Parallels installed prior to provision the box.

git clone https://github.com/Icinga/icinga-vagrant.git
cd icinga-vagrant/icinga2x
vagrant up

The initial provisioning takes a while depending on your internet connection.
Each web frontend is available on its own using the host-only network address 192.168.33.5:

Icinga Web 2 http://192.168.33.5/icingaweb2 icingaadmin/icinga
PNP4Nagios http://192.168.33.5/pnp4nagios
Graphite Web http://192.168.33.5:8003
Grafana 2 http://192.168.33.5:8004 admin/admin
Dashing http://192.168.33.5:8005


Weekly Snap: NETWAYSGrapherV2 update, World Cup telecoms, OpenITSM

24 – 28 May announced a NETWAYSGrapherV2 performance update, touched on open source IT Services Management, and looked forward to the World Cup from a telecommunications and NagVis perspective.
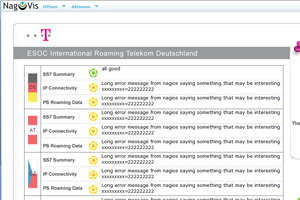
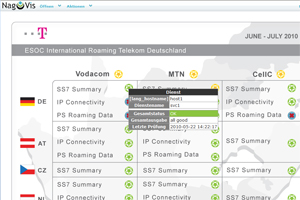
Karo got excited about the World Cup coming up in South Africa – and the telecommunications services that Deutsche Telekom customers will be able to enjoy during their stay over there. With Nagios monitoring their three roaming partners on the ground and special plugins to ensure internet login and connectivity, SMS, MMS and data transfers all should flow smoothly during the World Cup craze. To top it off, Deutsche Telekom operators will be able to constantly monitor the smooth running of communication channels through a new NagVis dashboard we recently created for them.
Following on the sevices theme, Julian shared his presentation on ‘IT Service Management with Open Source Software “OpenITSM”’ which he recently made at the Open Expo 2010 in Bern. The presentation covers various open source tools for Incident & Problem Management, Event Management, Operations Management, Service Desk and CMDB.
Finally Eric thanked the many people who gave us feedback since the release of the final NETWAYSGrapherV2 with a small update to improve the chart display in the dashboard and panels. No excuse to make a trip to the coffee machine, now that the performance is significantly better for large environments. As always, get the update from netways.org.

Jetzt wird`s sportlich: NagVis Projekt zur FIFA WM 2010

 
Zur FIFA WM 2010 werden sicher viele Deutsche nach Südafrika reisen um vor Ort live dabei zu sein. Zumindest die Kunden von Telekom Deutschland können sicher sein, dass sie vor Ort immer eine gute Verbindung nach Hause haben, denn die Verbindung zu den drei Roaming Partnern in Süd Afrika wird kontinuierlich mit Nagios überwacht.
Spezielle Nagios Plugins stellen sicher dass das Einbuchen in den Netzen, der Verbindungsaufbau, SMS, MMS und Datenverbindungen nach Hause jederzeit möglich sind. Im Rahmen eines neuen Projekts haben wir nun für Telekom Deutschland ein Dashboard auf Basis von NagVis erstellt, mit dem die Operatoren während der WM jederzeit sehen können, ob die Kommunikationskanäle problemlos funktionieren. Sollten technische Schwierigkeiten auftreten kann Telekom Deutschland so wesentlich schneller die notwendigen Maßnahmen ergreifen.

Freie Icons für RZ Visualisierung

globeDas Rechenzentrum der Uni Erlangen-Nürnberg (RRZE) hat eine interne Sammlung von verschiedenen Rechenzentrums-Icons unter einer freien Lizenz (CC-BY-SA 3.0) veröffentlicht. Mit den Icons lassen sich alle möglichen Sachverhalte, beispielsweise in Dokumentationen besser visualisieren ohne auf kommerzielle Lösungen wie Visio o.ä. ausweichen zu müssen. Und natürlich kann man die Icons auch sehr einfach in Visualisierungslösungen wie beispielsweise NagVis für Nagios einbinden.
Durch die Verwendung der Creative Commons Lizenz darf man die Symbole verwenden, verbreiten und sogar modifizieren, solange man weiter die ursprünglichen Autoren nennt und die Dateien unter der gleichen Lizenz weitergibt, unter der man sie auch bekommen hat.
Die Symbole stammen ursprünglich aus einem internen Projekt des RRZE zum Thema Identity Management. In der Gallery des Projektes lassen sich die Icons einzeln betrachten und in verschiedenen Auflösungen oder sogar als Vektordatei herunterladen.

Julian Hein
Julian Hein
Executive Chairman

Julian ist Gründer und Eigentümer der NETWAYS Gruppe und kümmert sich um die strategische Ausrichtung des Unternehmens. Neben seinem technischen und betriebswirtschaftlichen Background ist Julian häufig auch kreativer Kopf und Namensgeber, beispielsweise auch für Icinga. Darüber hinaus ist er als CPO (Chief Plugin Officer) auch für die konzernweite Pluginstrategie verantwortlich und stösst regelmässig auf technische Herausforderungen, die sonst noch kein Mensch zuvor gesehen hat.

CeBIT Live 2009 – 3. Tag: Der besucherstärkste Tag auf der CeBIT

Wie auch im Vorjahr, ist auch in diesem Jahr am Donnerstag bisher am meisten los. Auch unser Kollege Michael, der heute am SUN Stand vertreten ist berichtet Ähnliches. „Hier brennt die Hütte und der Stand ist durchgehend besetzt, viele interessiert, was SUN mit Nagios zu tun hat. So ist es bei uns am NETWAYS Stand. Streckenweise waren alle vier Kollegen gleichzeitig im Gespräch und weitere Besucher mussten „auf den nächsten freien Kollegen“ warten. Das freut uns natürlich, vor allem, da im Vorfeld so viel vom Rückgang der Besucher berichtet wurde, scheinbar aber nicht das Interesse an Open Source Lösungen. Wir vermuten im Moment sogar, dass in diesem Jahr mehr Besucher als 2008 den Weg zu uns gefunden haben.
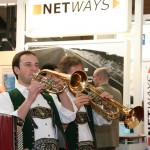
Als besonderes „Schmankerl“ hat Bayern Innovativ auch in diesem Jahr eine original bay. Blaskapelle arrangiert, besonders zur Freude unserer ausländischen Besucher.:-) Wer noch in den Genuss kommen möchte: die Herren sind bis 18:30 Uhr in Halle 9 Stand B20.
Besonders gefreut haben wir uns über den Besuch von Michael Lübben (NagVis) und Jörg Linge (PNP4Nagios), die heute gegen Mittag zur CeBIT angereist sind. Aktuell besprechen sich die beiden mit Julian und Bernd rund um das Thema Nagios. Man darf gespannt sein wie das Fazit der CeBIT ausfällt.