Seite wählen

NETWAYS Blog

OSMC 2013: Der Countdown läuft – nur noch 71 Tage

Unser Eric performt uns heute einen Vortrag über Performance graphing mit inGraph. Und das alles nur, damit es bis zur OSMC 2013 nicht langweilig wird.


OSMC? Was soll das denn sein und wer sind die netten Menschen in diesen Videos?Die Open Source Monitoring Conference (kurz: OSMC) ist die internationale Plattform für alle an Open Source Monitoring Lösungen Interessierten, speziell Nagios und Icinga. Jedes Jahr gibt es hier die Möglichkeit sein Wissen über freie Monitoringsysteme zu erweitern und sich mit anderen Anwendern auszutauschen. Die Konferenz richtet sich besonders an IT-Verantwortliche aus den Bereichen System- und Netzwerkadministration, Entwicklung und IT-Management. Und die netten Menschen, die Ihr in unseren Videos zur OSMC seht, gehören dazu. 2013 wird die OSMC zum 8. Mal in Nürnberg stattfinden.
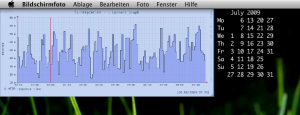
Nagios & GeekTool – RRD als Hintergrundbild

GeekTool ist ein kleines schickes Tool für den Mac, um die Ausgabe von Bildern, Logs oder Scripts als Hintergrund auf dem Desktop einzublenden.
geektool
Nach der Installation des Tools bietet ein zusätzliches PrefPane in den Systemeinstellungen die Möglichkeit Gruppen und deren Objekte anzulegen.
Um ein NagiosGrapher-RRD als Hintergrund einzublenden ist lediglich der Link der PNG-Darstellung in die Picture-URL einzutragen und ein entsprechenden Refresh-Intervall einzustellen.
Beispiel:
[code lang=“bash“]http://guest:guest@nagios.demo.netways.de/nagios/cgi-bin/rrd2-system.cgi?host=f1-http;service=HTTP;width=720;height=250;type=AVERAGE;title=1%20Current;start=-21600;end=1248853060;imageformat=png[/code]
Schon erscheint der Graph an der gewünschten Stelle des Bildschirms.
Neben der Anzeige von Bildern, kann auch die Ausgabe eines Scripts oder Commands nützlich sein. Zur Anzeige des aktuellen Monatskalenders genügt folgendes Command:
[code lang=“bash“]cal[/code]
Ja, mehr ist es nicht.
Bei Erstellung eines Links auf cal mit dem Namen ncal und der Option -w bekommt auch noch die Kalenderwochen präsentiert. Für mich ein Killerfeature.
screen

Bernd Erk
Bernd Erk
CEO

Bernd ist Geschäftsführer der NETWAYS Gruppe und verantwortet die Strategie und das Tagesgeschäft. Bei NETWAYS kümmert er sich eigentlich um alles, was andere nicht machen wollen oder können (meistens eher wollen). Darüber hinaus startete er früher das wöchentliche Lexware-Backup, welches er nun endlich automatisiert hat. So investiert er seine ganze Energie in den Rest der Truppe und versucht für kollektives Glück zu sorgen. In seiner Freizeit macht er mit sinnlosen Ideen seine Frau verrückt und verbündet sich dafür mit seinen beiden Söhnen und seiner Tochter.

Ask the developer: NagiosGrapher


What is NagiosGrapher?
NagiosGrapher is a Nagios add on which automatically generates performance charts and graphs from returned Nagios values. It takes the raw Nagios data and turns it into normalised values administrators can analyse, either on its own or Nagios’ web interface.
NagiosGrapher and NETWAYSGrapherV2 – what’s the difference?
They use a completely different architecture. NagiosGrapher is the predecessor to NETWAYSGrapherV2, but as it is so popular in the community, we decided to keep the project running. We’ve invested the latest technologies in the NETWAYSGrapherV2 however, and that is our main ‘grapher’ project.
How does it work?
Nagios plugins run checks on hosts and services, returning results in strings of extended information. The NagiosGrapher daemon receives these via perf-files or a pipe, filters them of numeric data by using regular expressions  and stores the data in a RRD (Round Robin Database). The functions we built use the RRD to create graphs from the data values and are generated on request – in real-time (or within 5 min). All interaction can be made on a Perl CGI based front end, or through the Nagios system itself.
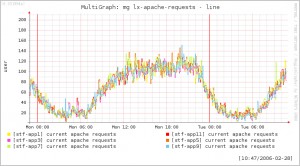
Any interesting features?multigraphs
Aside from the real-time graphing as mentioned above, NagiosGrapher also does ‘Mulit-graphs’. Several different graphs can be brought together and displayed in one view, which is quite handy when analysing multiple switch ports for example.
NagiosGrapher also features a ‘process-service-perfdata’ interface, so no patches or changes to the Nagios system needs to be made. This ensures that it is easy to install and maintain. Unlike some other programs, you don’t need to repeat installations because it automatically recognises new devices and services, incorporating their monitoring values for graphing. And because it runs on RRD with automated data cleanup, the database stays at a fixed size, keeping the backend slim.

What is the ‘process-service-perfdata’ interface exactly?

This is an extra specialised interface between Nagios and the RRD where the returned Nagios performance values are normalised. Because it acts as a kind of translation device, no patches or alterations need to be made to Nagios itself, making installation and operation much smoother.
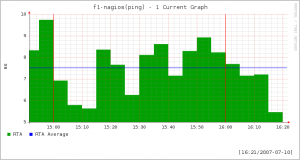
f1-nagios_ping_1currentHow does it compare to other graphing tools?
NagiosGrapher is one of the most popular, longstanding graphing tools for Nagios, alongside nagiosgraph and PnP. Where PnP is easier and faster to configure, it only reads perfdata. NagiosGrapher is more complex but can check older plugin output, and breaks into components easily, thus being also more flexible. This makes it fantastic to scale and implement in large environments.
Any plans for further developments?
NagiosGrapher has been around for quite a while now, but at least it’s reliably stable and very robust. Basically, we’ll keep with maintenance and patches but really our main development work is on the NETWAYSGrapherV2 – speaking of which, we have just released the RC1.
NagiosGrapher in a nutshell?
The old-timer basic Grapher for reliable performance charts, easy to install, easy to maintain and good for large environments – but not as dynamic as the new NETWAYSGrapherV2!
More information:
Join the project or download

Bring it on! NETWAYSGrapherV2 rc1 released!


Originally presented at Conference on Nagios 2008 as a prototype, the first release candidate of NETWAYSGrapherV2 is now ready.
It uses the NETWAYS AppKit – a framework developed to provide a fully featured base for the Grapher – and real-time charts are implemented in Adobe Flex .
The new installer is supposed to ease the pain of previous installation processes, and the major features are listed below because we didn’t want to spend so long writing complete sentences…

  • PHP frontend
  • extensive use of Ajax
  • Adobe Flex chart engine
  • MySQL backend
  • internal housekeeping of data (similar to RRD)
  • real-time aggregation of data
  • dashboards (configuration via web frontend)
  • user- and role management via frontend
  • Ajax search for hosts and services
  • full-screen view
  • navigation toggle
  • automatic data collector for perf data and plugin output
  • full support for check multi

Let’s download the archive of pleasure right now from netways.org, the new platform for Open-Source Projects from NETWAYS, which enables everybody to create new bug reports and feature requests.
Have fun!

Jetzt isses raus! NETWAYSGrapherV2 rc1 veröffentlicht!


Auf der NETWAYS Nagios Konferenz 2008 bereits als Prototyp vorgestellt, wurde nun nach langer Zeit der erste Release Candidate des NETWAYSGrapherV2 fertiggestellt.
Das für den Grapher eigens entwickelte Framework „NETWAYS AppKit“ bildet die Grundlage für eine neue Generation von Charting Software welche bei der Darstellung von Graphen auf Adobe Flex setzt, um eine bessere Darstellung von Echtzeitgraphen zu ermöglichen.
Der mitgelieferte Installer soll weitere graue Haare verhindern, welche durch viele andere Installationen möglicherweise schon hervorgetreten sind und die folgende Liste an Features soll dafür sorgen, dass jetzt nicht noch ein paar Absätze gelesen werden müssen.
Ein paar Merkmale:

  • PHP frontend
  • umfangreicher Verwendung von Ajax
  • Flex chart engine
  • MySQL backend
  • internes housekeeping der Daten (ähnlich RRD)
  • Echtzeitaggregationen von Daten
  • eigene, durch das web frontend konfigurierbare, Dashboards
  • Benutzer- und Rollenpflege per frontend
  • Ajax-Suche für hosts und services
  • Vollbildansicht
  • zusammenklappbare Navigation
  • automatisches Sammeln von Performance-Daten aus plugin outputs und perf data
  • volle Unterstützung für check multi

Das ganze Paket voller Freude steht ab sofort unter netways.org, der neuen Plattform für Open-Source-Projekte von NETWAYS, zur Verfügung. Auf der neuen Plattform können übrigens auch von jedermann neue Issues für Bugs und Features angelegt werden, damit die Software schnellstmöglich und dauerhaft den Wünschen und Ideen der  Community gerecht wird.
Viel Spaß damit!