Before using Graphite in production, you should be aware of how much load it can handle. There is nothing worse than finding out your carefully planned and build setup is not good enough. If you are already using Graphite, you might want to know the facts of your current setup. Knowing the limits of a setup helps you to react on future requirements. Benchmarking is essential if you really want to know how many metrics you can send and how many requests you can make. To find this out, there are some tools out there that help you to run benchmarks.
Requirements
The most important thing you need when starting to benchmark Graphite is time. A typical Graphite stack has 3 – 4 different components. You need plenty of time to properly find out how much load each of them can handle and even more to decide which settings you may want to tweak.
Haggar
Haggar is a tool to simulate plenty of agents that send generated metrics to the receiving endpoint of a Graphite stack (carbon-cache, carbon-relay, go-carbon, etc…). The amount of agents and metrics is configurable, as well as the intervals. Even though Haggar does not consume much resources, you should start it on a separate machine.
Haggar is written in go and installed with the go get command. Ensure that Go (>= v1.8) is installed and working before installing Haggar.
Installing Haggar
go get github.com/gorsuch/haggar
You’ll find the binary in your GOPATH that you have set during the installation of Go previously.
Running Haggar:
$GOPATH/bin/haggar -agents=100 -carbon=graphite-server.example.com:2003 -flush-interval=10s -metrics=1000
Each agent will send 1000 metrics every 10 seconds to graphite-server.example.com on port 2003. The metrics are prefixed with haggar. by default. The more agents and metrics you send, the more write operations your Graphite server will perform.
Example output of Haggar:
root@graphite-server:/opt/graphite# /root/go/bin/haggar -agents=100 -carbon=graphite-server.example.com:2003 -flush-interval=10s -metrics=1000
2017/09/21 09:33:30 master: pid 16253
2017/09/21 09:33:30 agent 0: launched
2017/09/21 09:33:42 agent 1: launched
2017/09/21 09:33:46 agent 2: launched
2017/09/21 09:34:00 agent 0: flushed 1000 metrics
2017/09/21 09:34:02 agent 1: flushed 1000 metrics
2017/09/21 09:34:06 agent 2: flushed 1000 metrics
Testing the write performance is a good starting point, but it’s not the whole truth. In a production environment data is not only written but also read. For example by users staring at dashboards all day long. So reading the data is as much important as writing it because it also produces load on a server. This is where JMeter comes into play.
JMeter
Apache JMeter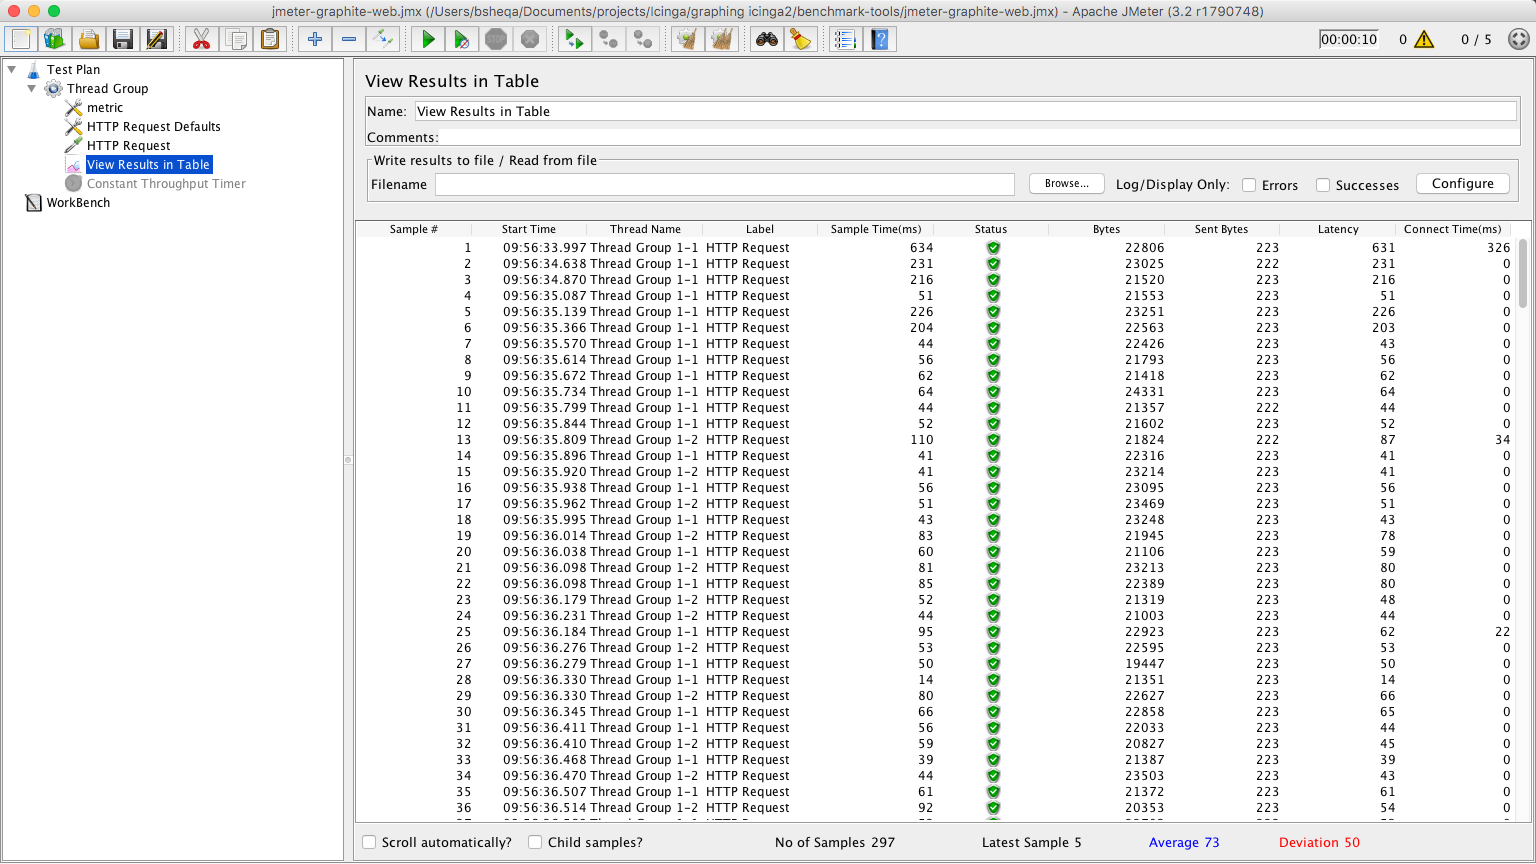 usually is used to test the performance of web applications. It has many options to simulate requests against a web server. JMeter can also be used to simulate requests against Graphite-Web. You should do this simultaneously while Haggar is sending data, so you have the “complete” simulation.
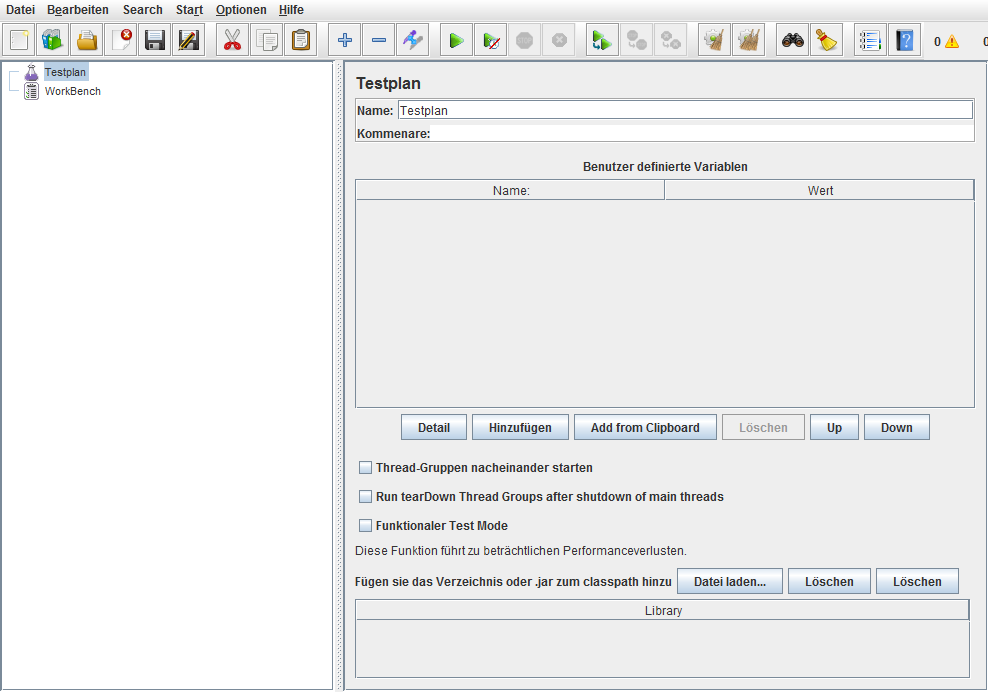
The easiest way to configure JMeter is the graphical interface. Running test plans is recommended on the command line, though. Here’s an example how I set up JMeter to run requests against Graphite-Web:
- Add a
Thread Groupto theTest Plan- Set the Number of Threads (eg.
5) - Set the loop count to
Forever
- Set the Number of Threads (eg.
- Add a
Random Variableto theThread Group- Name the variable
metric - Set the minimum to
1 - Set the maximum to
1000 - Set `Per Thread` to
true
- Name the variable
- Add another
Random Variableto theThread Group- Name the variable
agent - Set the minimum to
1 - Set the maximum to
100 - Set
Per Threadtotrue
- Name the variable
Haggar uses numbers to name it’s metrics. With these variables we can create dynamic requests.
- Add a
HTTP Request Defaultsto theThread Group- Set the server name or IP where your Graphite-Web is running (eg.
graphite-server.example.com) - Add the path
/renderto access the rendering API of Graphite-Web - Add some parameters to the URL, examples:
- width:
586 - height:
308 - from:
-30min - format:
png - target:
haggar.agent.${agent}.metrics.${metric}
- width:
- Set the server name or IP where your Graphite-Web is running (eg.
The most important part about the request defaults is the target parameter.
- Add a
HTTP Requestto theThread Group- Set the request method to
GET - Set the request path to
/render
- Set the request method to
- Add a
View Results in Tableto theThread Group
The results table shows details of each request. On the bottom there is an overview of the count of all samples, the average time and deviation. Optionally you can also add a Constant Throughput Timer to the Thread Group to limit the requests per minute.
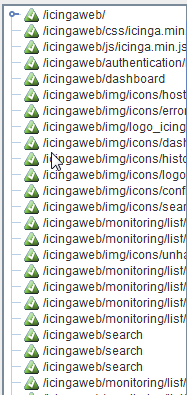
If everything is working fine, you can now start the test plan and it should fire lots of requests against your Graphite-Web. For verification, you should also look into the access logs, just to make sure.
At this point your Graphite server is being hit by Haggar and JMeter at the same time. Change the settings to find out at which point your server goes down.
Interpretation
Obviously, killing your Graphite server is not the point of running benchmarks. What you actually want to know is, how each component behaves with certain amounts of load. The good thing is, every Graphite component writes metrics about itself. This way you get insights about how many queries are running, how the cache is behaving and many more.
I usually create separate dashboards to get the information. For general information, I use collectd to monitor the following data:
Load,CPU,Processes,I/O Bytes,Disk Time,I/O Operations,Pending I/O Operations,Memory
The other dashboards depend on the components I am using. For carbon-cache the following metrics are very interesting:
Metrics Received,Cache Queues,Cache Size,Update Operations,Points per Update,Average Update Time,Queries,Creates,Dropped Creates,CPU Usage,Memory Usage
For carbon-relay you need to monitor at least the following graphs:
Metrics Received,Metrics Send,Max Queue Length,Attempted Relays,CPU Usage,Memory Usage
All other Graphite alternatives like go-carbon or carbon-c-relay also write metrics about themselves. If you are using them instead of the default Graphite stack, you can create dashboards for them as well.
Observing the behaviour during a benchmark is the most crucial part of it. It is important to let the benchmark do its thing for a while before starting to draw conclusions. Most of the tests will peak at the start and then calm after a while. That’s why you need a lot of time when benchmarking Graphite, every test you make will take its own time.
Performance Tweaks
Most setups can be tuned to handle more metrics than usual. This performance gain usually comes with a loss of data integrity. To increase the number of handled metrics per minute the amount of I/Ops must be reduced.
This can be done by forcing the writer (eg. carbon-cache) to keep more metrics in the memory and write many data points per whisper update operation. With the default carbon-cache this can be achieved by setting MAX_UPDATES_PER_SECOND to a lower value than the possible I/Ops of the server. Another approach is to let the kernel handle caching and allow it to combine write operations. The following settings define the behaviour of the kernel regarding dirty memory ratio.
vm.dirty_ratio(eg.80)vm.dirty_background_ratio(eg.50)vm.diry_expire_centisecs(eg.60000)
Increasing the default values will lead to more data points in the memory and multiple data points per write operation.
The downside of these techniques is that data will be lost on hardware failure. Also, stopping or restarting the daemon(s) will take much longer, since all the data needs to be flushed to disk first.