Seite wählen

NETWAYS Blog

OSMC 2023 | What’s new with Grafana Labs’s Open Source Observability stack

I already mentioned in my recap of this year’s OSMC that I will go into more details about Sebastian Schubert’s talk giving an update on Grafana Labs’s Open Source Observability stack. In fact, I was so interested in the topic I volunteered for this blog post and made our Event team assign me the talk.
You may ask why, so you very likely are one of those who know Grafana very well but have not heard of all the other tools Grafana Labs has added to their stack over the last years. I myself just started a while ago digging deeper into it, and it feels like I can find some gold nugget down there. So I want to spread the word and perhaps cause a gold rush! 😉


Grafana

Sebastian started with a short introduction of him and by asking the audience who knows Grafana Logo Grafana. He was excited for sure that everyone in crowd did know about Grafana. So let’s start with the updates on Grafana. With Grafana being around for quite a while and having become the dashboard solution to go for most people it does not wonder that the most improvements are small but helpful convenience features. His examples were how the empty dashboard and panel editor were improved to help users to get the best representation of their data. Another improvement was the UI helping specifically with writing TraceQL queries instead of just taking an already existing statement which could be hard to come up with.

A completely new thing is the Visual Studio Code integration for editing and previewing dashboards. Looking at the number of colleagues using it, seeing integrating in many other tools as their Web IDE (integrated development environment) and personally thinking it is the best solution developed by Microsoft, having such an integration will make many people happy and grow the user base further.

But Grafana Labs does not only want to grow the user base, they also want to make developer’s life easier by working on a Developer Portal which combines all related information in one place. Please learn a lesson from this if working on a project where it is hard to get all the information needed to get into it!

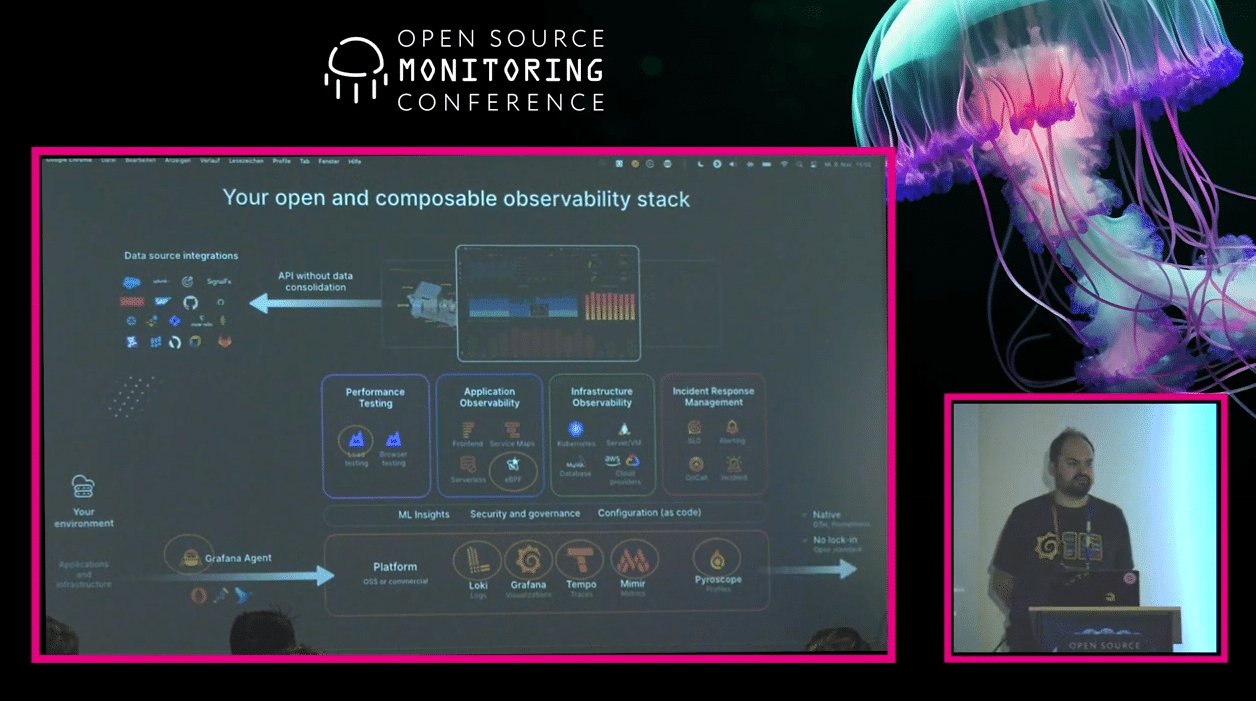
Screencapture of the talk at the beginning

Mimir

While Mimir Logo Mimir is also around for some time, the metric solution of the stack needs some introduction especially compared to its more well-known competitors. Mimir is the (or one) successor of Cortex and the equivalent to Grafana Enterprise Metrics as an Open Source solution. Something Grafana Labs did with the complete stack, providing an equivalent to its Enterprise solution for the community as true Open Source.

Mimir was extended and improved over the last year. Most improvements I would summarize as performance enhancement in some way. But there were also new features added like allowing for alerts being sent to Webex or support for Redis as caching solution and Hashicorp Vault for more secure credential storage.


Loki

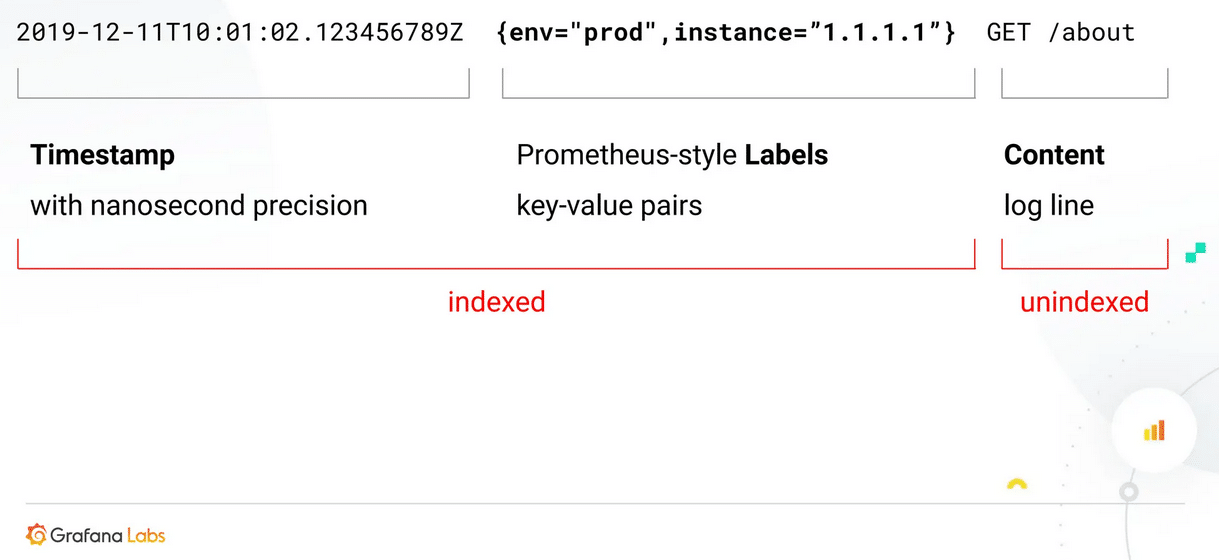
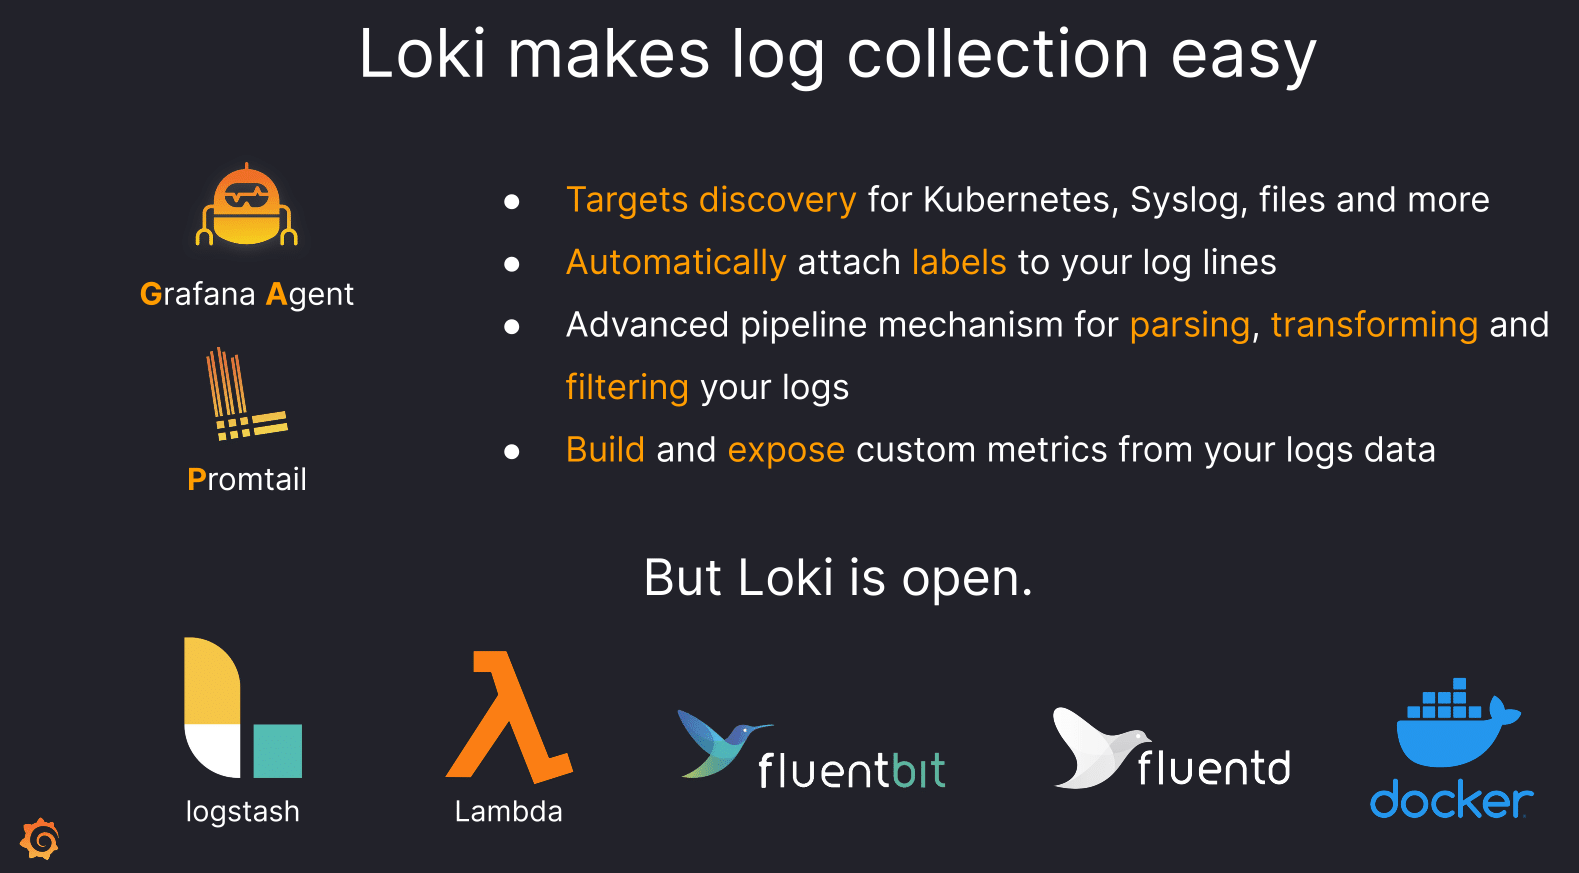
Loki Logo Loki has a similar problem like Mimir. It has more established competitors as log management solutions so it is not known by so many people, but I think it has some advantages you should be aware of. Sebastian did compare it more to Prometheus than its competitors as it uses a similar label-based design. On his format slide he explained this very well that an entry for Loki consists of a timestamp in nanoseconds and labels which get indexed to speed up queries and the not indexed content allowing for post-processing where all other solutions require you to optimize your data for the expected queries already before storing them.

Loki format

As you may guess post-processing could be the bottleneck in such a design, but Loki has solved this already quite well and Grafana Labs is constantly reducing the resource consumption what made me happy to hear.


Tempo and all the other components

Speaking about Tempo Logo Tempo Sebastian had to increase his at this point of the talk recognizing he can barely fit all the updates from one year for the complete stack in one talk. So starting with the solution for traces he got less into details. Tempo is comparable to the other solutions mentioned earlier but for traces and for this it needs many data.

Beyla Logo Beyla is another tool for tracing with a release pending and very likely to be shown in detail to the public in the near future.

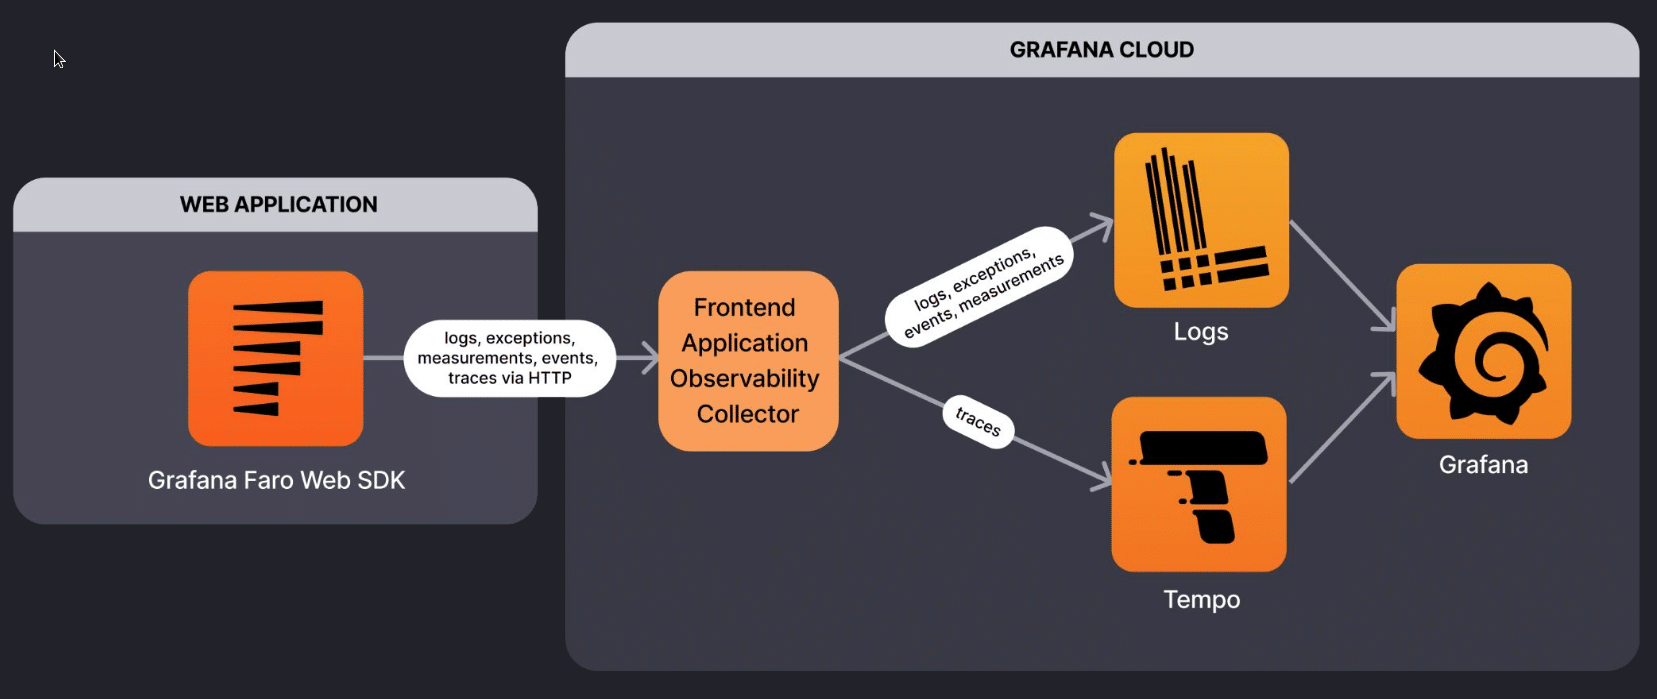
Faro Logo Faro adds Frontend/Browser monitoring to the stack allowing to get details on the real user experience.

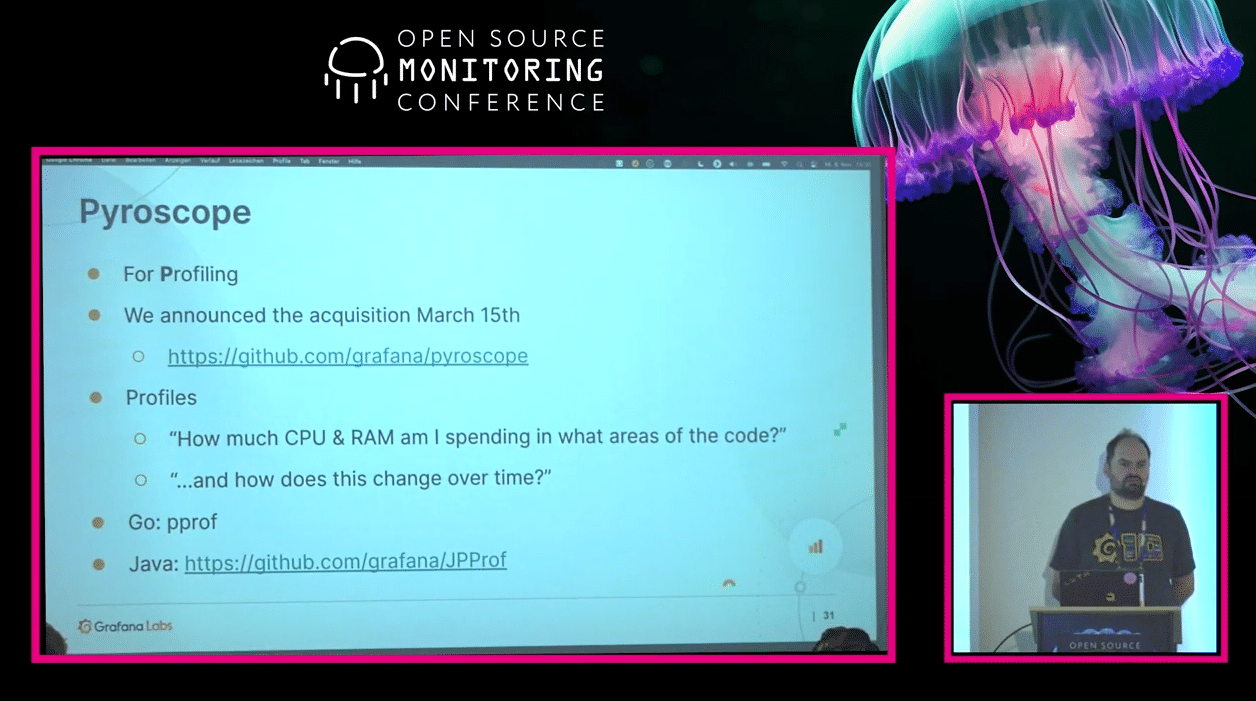
And last but not least Pyroscope Logo Pyroscope adds profiling which makes the stack cover a very big amount of data. All of those being visualized in the end as a dashboard in Grafana.

Screencapture of the talk at the end

So I really recommend at least having a look into the stack and watching the recording of Sebastian Schubert’s talk „What’s new with Grafana Labs’s Open Source Observability stack“ is a good starting point for this! Another starting point could be our training on InfluxDB & Grafana.

We hope to see you around at OSMC 2024! Stay in touch and subscribe to our Newsletter!

Dirk Götz
Dirk Götz
Principal Consultant

Dirk ist Red Hat Spezialist und arbeitet bei NETWAYS im Bereich Consulting für Icinga, Puppet, Ansible, Foreman und andere Systems-Management-Lösungen. Früher war er bei einem Träger der gesetzlichen Rentenversicherung als Senior Administrator beschäftigt und auch für die Ausbildung der Azubis verantwortlich wie nun bei NETWAYS.

OSMC 2022 | The Power of Metrics, Logs & Traces with Open Source

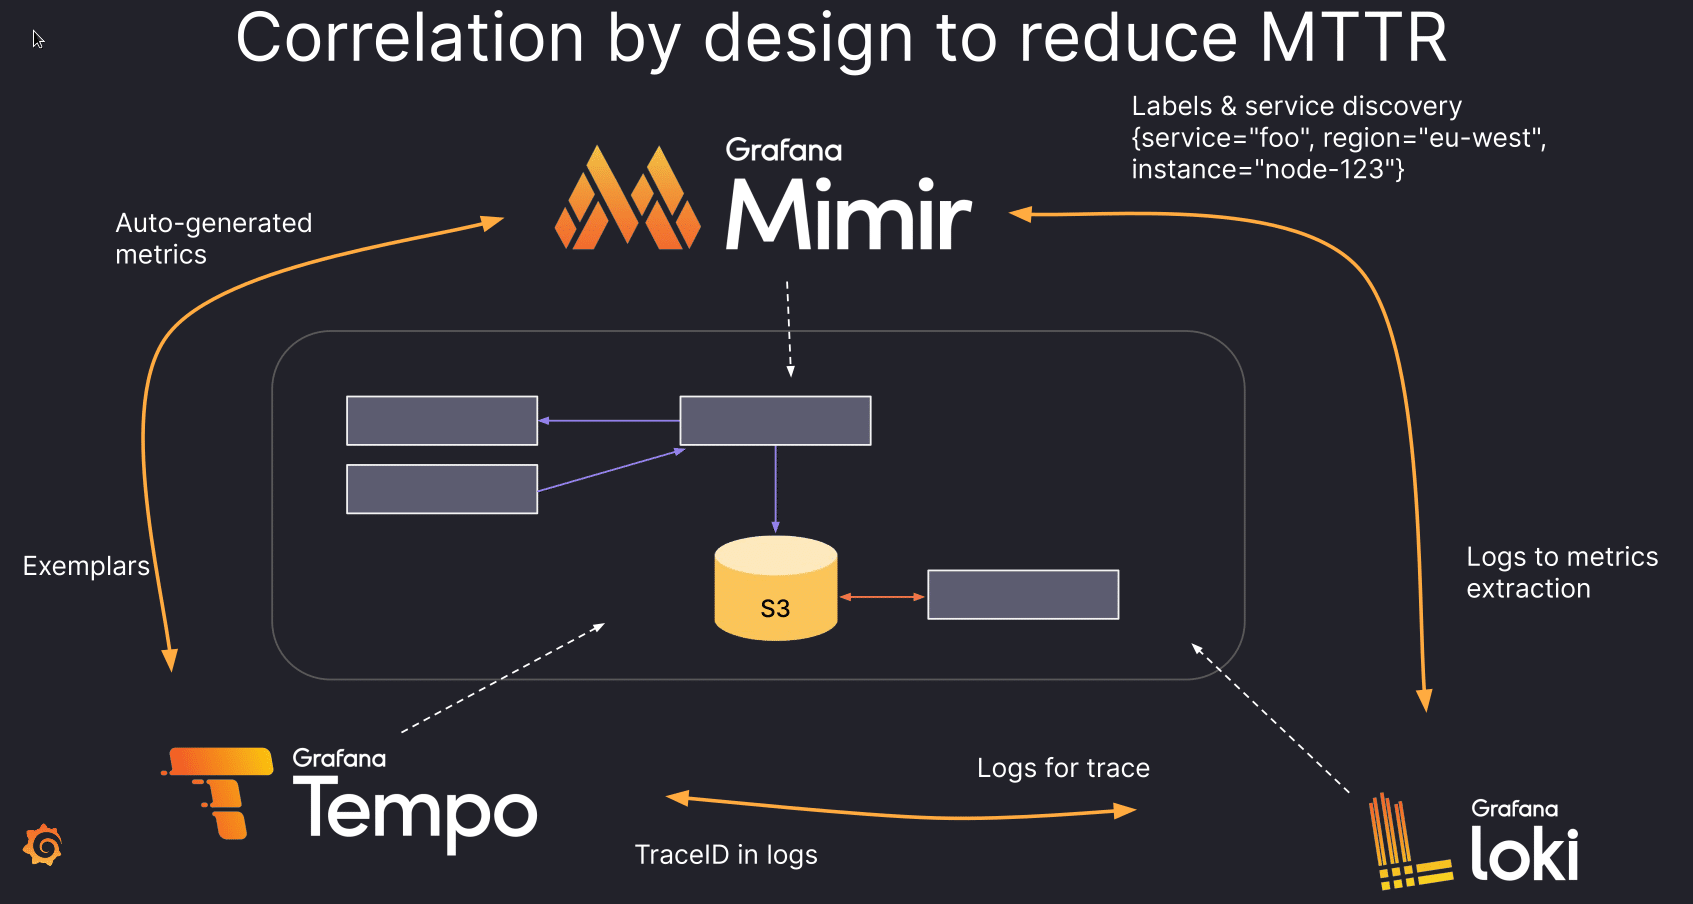
In his talk at our Open Source Monitoring Conference OSMC Emil-Andreas Siemes showed how organisations can drastically reduce their MTTR (Mean Time To Repair) by using, integrating and correlating the Open Source tools Mimir, Loki & Tempo. He also talked about Open Source reliability testing to even avoid problems in the first place. And yes, with the use of Grafana. The moment Emil asked the crowd who uses Grafana, and I looked around, almost every single hand in the entire conference room was up.

Essentials on the Grafana Stack

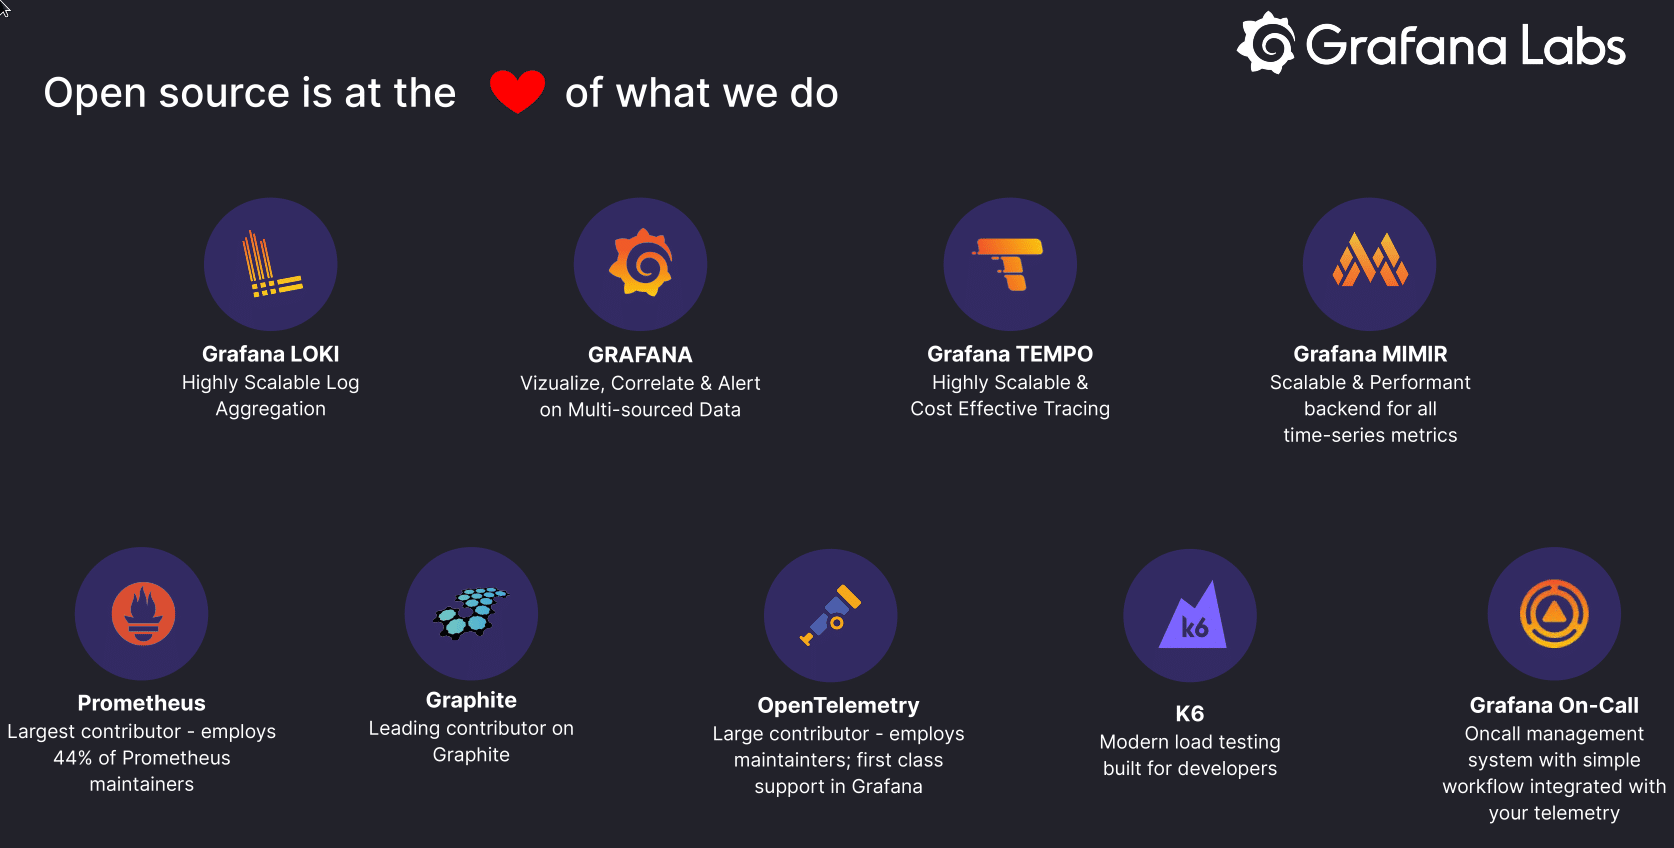
Today Grafana labs employs over 1000 employees, improving observability. The core projects to pull this off are:

The Grafana Stack is also known as LGTM: Loki for logs, Grafana for visualization, Tempo for traces, and Mimir for metrics. In addition they employ 44 % of Prometheus maintainers, and provide the Grafana Mimir long term storage.

Grafana Faro

Emil emphasized the importance of OpenTelemetry which a standard for traces, metrics and logs (including metadata) and the way Tempo (traces) and Loki (log ingestion & aggregation) work together with Mimir. Another important point of the talk was a new way how Grafana Faro, an Open Source web SDK is able to provide frontend application observability!

Emil showed a Faro demo, and webvitals such as TTFB, FCP, CLS, LCP, FID were able to be picked up. This might be something very interesting for web and app developers in the future to improve and monitor their applications.

Improvements to Loki

Finally Emil discussed improvements to Loki, whose performance was significantly improved by 4x faster queries, and 50% less CPU power. Then LogQL was discussed and examples for Log & Metrics queries were shown, which should be quickly picked up by those familiar with PromQL.

Helping you get more observability

Overall the talk was a great way to get introduced and updated on the Grafana ecosystem. In case you need help to provide visibility and scaling to your ecosystem, at NETWAYS we provide consulting for integrating Grafana into your infrastructure. Feel free to contact us, and see you at the next event!

The recording and slides of this talk and all other OSMC talks can be found in our Archives. Check it out! We hope to see you around at OSMC 2023! Stay in touch and subscribe to our Newsletter!
Icinga for Windows Preview: Visualisiert eure Metriken!

Icinga hat in seinem Blogpost mitgeteilt, dass es mit Icinga for Windows v1.10.0 einige Änderungen an den Performance Metriken geben wird. Hier wollen wir einmal grob zusammenfassen, worum es geht und welche Auswirkungen diese Änderungen haben. Für alle Details ist der Original-Post aber sehr zu empfehlen!

Das Label-Problem

Ein grundlegendes Problem in aktuellen Icinga for Windows Versionen ist die Tatsache, dass die Labels für Performance Metriken zwar automatisch vom Icinga PowerShell Framework generiert werden, jedoch eine Filterung auf diese Werte innerhalb von Grafana nicht so einfach möglich ist. Nimmt man sich einmal das Partition-Space Plugin zur Hand, sehen die Metriken wie folgt aus:

‚free_space_partition_c’=10328260000B;;;0;491811100000

‚used_space_partition_c’=481483000000B;;;0;491811100000

Das Label ändert sich dabei, je nachdem ob das Plugin den Free- oder Used-Space der Partitionen überwacht. An sich wäre das nicht schlimm, da Grafana ja das Filtern über mehrere Metriken hinweg erlaubt. Jedoch ergeben sich Probleme bei komplexen Plugins oder wenn verschiedene Plugins eine ähnliche Struktur der Performance Metriken liefern – dann ist nicht mehr abzugrenzen, woher eine Metrik kommt.

Check_Multi Label

Um diesem Problem entgegenzuwirken, gibt es mit Icinga for Windows v1.10.0 im August einen Breaking Change: Alle Performance Metriken werden künftig im check_multi Format geschrieben. Dadurch ergeben sich eine Vielzahl von Vorteilen, da im Vorfeld schon während der Label Generierung ein Index, ein Template sowie ein Metrik Name definiert werden kann. Im Beispiel der oberen Performance Werte, sieht das Ergebnis dann wie folgt aus:

‚c::ifw_partitionspace::used’=480627800000B;;;0;491811100000

‚c::ifw_partitionspace::free’=11178000000B;;;0;491811100000

In diesem Beispiel wäre der Index unsere Partition c, das Template für die Visualisierung ifw_partitionspace und der Name der Metrik used oder free. Sowohl der Index als auch der Metrik Name müssen innerhalb der Plugins mittels der Funktion New-IcingaCheck gesetzt werden. Hierfür gibt es dann neue Argument, -MetricIndex und -MetricName. Das Template, in unserem Beispiel ifw_partitionspace, wird dabei automatisch je nach Name des Check-Plugins gesetzt.

Natürlich ergibt sich hierdurch ein kleiner Mehraufwand für Entwickler während des Bauens der Plugins, jedoch sind die Daten in der Regel sowieso vorhanden und werden in bisherige Labels eingearbeitet, weshalb dieser überschaubar ist.

Metriken Visualisieren

Da es sich hierbei um einen Breaking Change handelt und deshalb vorhandene Grafana Dashboards nicht mehr funktionieren, gibt es eine gute Nachricht: Icinga liefert ab Tag 1 der Icinga for Windows v1.10.0 für alle Plugins Grafana Dashboards aus!

Aufgrund technischer Gründe ist ein Parallelbetrieb von alten und neuen Performance Metriken nicht möglich, daher wurde dies zum Anlass genommen, standardisierte und von Icinga gepflegte Dashboards bereitzustellen. Hierfür wird lediglich InfluxDB 2 sowie Grafana benötigt. Wer bereits eigene Dashboards erstellt hat, kann sich die vorgefertigten Dashboards als Basis hernehmen und seine Ansichten anpassen, während neue User sich direkt aus dem Portfolio bedienen können.

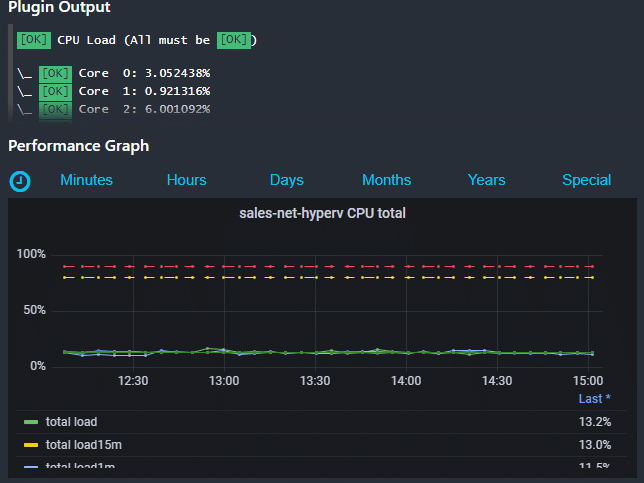
Icinga Web 2 CPU Metriken

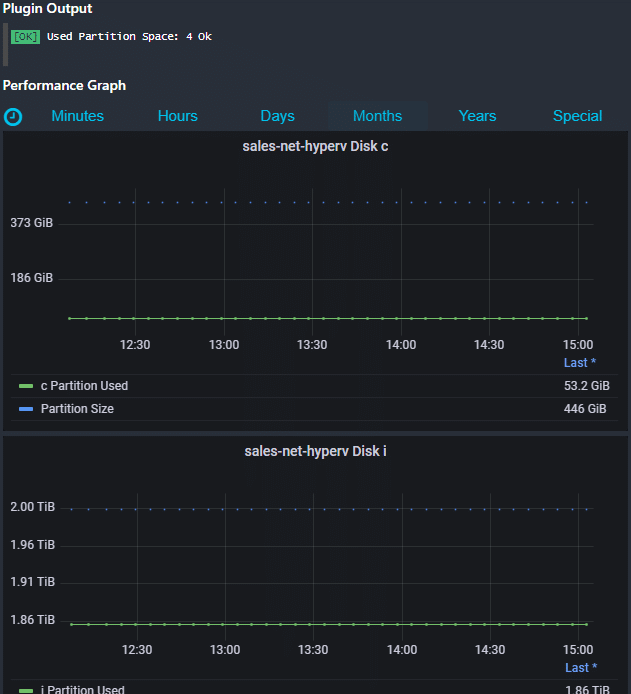
Icinga Web 2 Disk Metriken

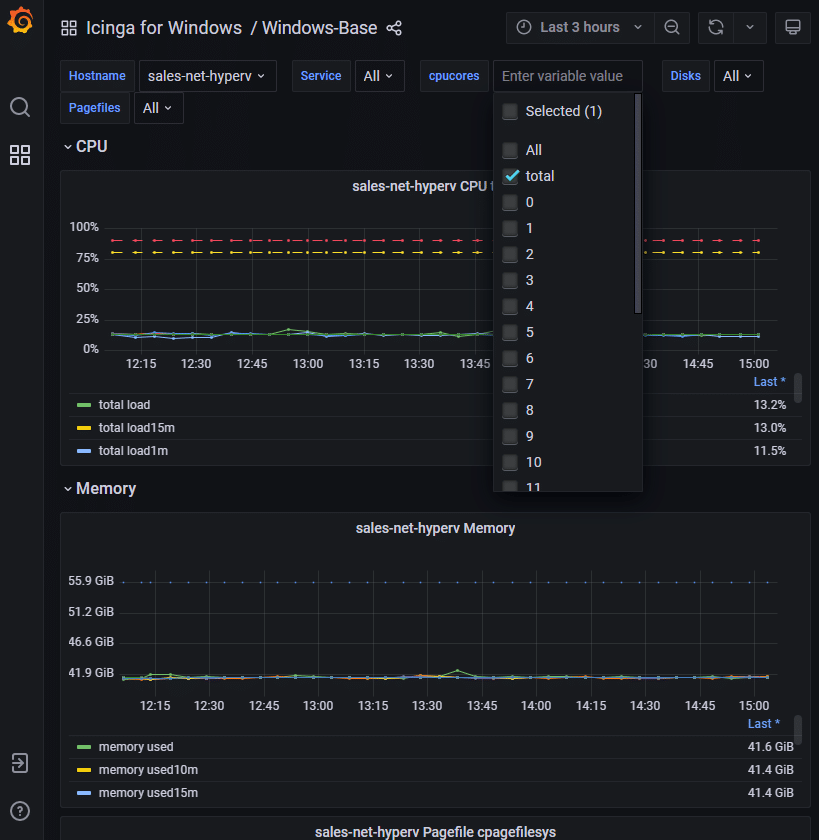
Grafana Basis-Dashboard für Icinga for Windows


Wir freuen uns bereits sehr auf den Release von Icinga for Windows v1.10.0 im August und helfen gerne beim Update, der Implementierung oder Erweiterung. Hierzu könnt Ihr gerne mit uns Kontakt aufnehmen!

Christian Stein
Christian Stein
Manager Sales

Christian kommt ursprünglich aus der Personalberatungsbranche, wo er aber schon immer auf den IT Bereich spezialisiert war. Bei NETWAYS arbeitet er als Manager Sales und berät unsere Kunden in der vertrieblichen Phase rund um das Thema Monitoring. Gemeinsam mit Georg hat er sich Mitte 2012 auch an unserem Hardware-Shop "vergangen".

Hol Dir Dein Profiwissen zu InfluxDB & Grafana und Foreman

Hast Du Lust, Dein Know-How über InfluxDB & Grafana oder Foreman zu erweitern? Unsere Open Source Experten sind bereit, ihr Wissen zu teilen und Dich zum Profi zu machen. Sie stehen tagtäglich in Kundenkontakt und wissen, worauf es bei den einzelnen Tools drauf ankommt.

Performance Monitoring mit InfluxDB & Grafana

In unserer Schulung über die Tools InfluxDB & Grafana lernst Du alles, was für ein erfolgreiches Performance Monitoring von größeren und komplexeren Umgebungen notwendig ist.

Unsere Trainer führen Dich schrittweise an den Aufbau und die Funktionsweise der Tools ran und festigen Dein Wissen anschließend in praktischen Übungen.

Die Themen im Einzelnen

  • Einführung in Performance Graphing
  • Überblick über unterschiedliche Graphing Komponenten
  • Aufbau und Installation von InfluxDB
  • Verwendung von InfluxDB Queries
  • Festlegen von Aufbewahrung und Aggregation
  • Nutzung von InfluxDB UI und Chronograf
  • Konfiguration von Dashboards mit Grafana
  • Nutzung und Erweiterung von Telegraf
  • Anbindung von CollectD und Icinga
  • Alternative Backends wie Graphite und OpenTSDB
  • Integration in Icinga Web
  • Troubleshooting und Best Practices
  • Alternative Komponenten

Die nächsten Termine

10. – 11. Mai 2022 | Online
25. – 26. Oktober 2022 | Online


Lifecycle Management mit Foreman

Foreman unterstützt Administratoren bei der Provisionierung virtueller und physikalischer Systeme mit anschließendem Kofigurationsmanagement. Das Tool bietet neben der grafischen Oberfläche eine Kommandozeile und eine API zur Einbindung in andere Anwendungen.

Unsere Trainer zeigen Dir in dieser Foreman Schulung alles zur Installation und Konfiguration sowie die grundsätzliche Architektur hinter Foreman, um im Anschluss verschiedene Möglichkeiten der Provisionierung zu testen.

Die Themen im Einzelnen

  • Foreman-Architektur
  • Installation von Foreman
  • Grundlagen der automatisierten Installation –
  • Kickstart/ Preseed/ Autoyast
  • Provisionierung von virtuellen und physikalischen Maschinen
  • Konfigurationsmanagement (am Beispiel Puppet und/oder Ansible)
  • Benutzermanagement
  • Weiterführende Nutzung und Erweiterungsmöglichkeiten (z.B. CLI, API)
  • Überblick über häufig genutzte Plugins

Die nächsten Termine

28. – 29. Juni | Nürnberg
22. – 23. November | Nürnberg


Das macht unsere Trainings besonders

Praxisnah

Unsere Schulungsleiter arbeiten regelmäßig in Software- und Kundenprojekten. Sie wissen, worauf es tatsächlich ankommt und teilen dieses Wissen mit Dir.

Individuell

Wir legen Wert darauf, die Gruppengrößen auf 10 Teilnehmer*innen zu begrenzen, um einen effizienten Lernprozess sicherzustellen. Freue Dich auf Deine individuelle Betreuung!

Kommunikativ

Auch in Zeiten wie diesen, ist uns der Austausch von Kursteilnehmer:innen untereinander besonders wichtig. Wir bieten Dir verschiedene Kanäle und Wege, sodass dem nichts mehr im Wege steht.

Haben wir Dein Interesse geweckt, dann informiere Dich gerne weiter über unsere Schulungen oder wirf einen Blick in unseren Schulungskalender!


Katja Kotschenreuther
Manager Marketing

Katja ist seit Oktober 2020 Teil des Marketing Teams. Als Manager Marketing kümmert sie sich hauptsächlich um das Marketing für die Konferenzen stackconf und OSMC sowie unsere Trainings. Zudem unterstützt sie das Icinga Team mit verschiedenen Social Media Kampagnen und der Bewerbung der Icinga Camps. Sie ist SEO-Verantwortliche für all unsere Websites und sehr viel in unserem Blog unterwegs. In ihrer Freizeit reist sie gerne, bastelt, backt und engagiert sich bei Foodsharing. Im Sommer kümmert sie sich außerdem um ihren viel zu großen Gemüseanbau.

Grafana queries InfluxDB

Christoph hat euch ja bereits in einem früheren Blogpost vor ca. einem Jahr näher gebracht wie man Icinga 2 und InfluxDB 2 miteinander „zum Reden“ bringt. Seit Icinga 2.13 steht nun auch der Influxdb2Writer zur Verfügung, welchen Afeef in seinem Blogpost benützt.

Ich möchte euch heute darauf basierend zeigen wie man nun das Setup erweitert und Grafana mit InfluxDB 2 konnektiert. Da InfluxDB 2 zum aktuellen Zeitpunkt sowohl die neue Flux Open Source Query Language (Flux) als auch noch die ältere Influx Query Language (InfluxQL) unterstützt, gibt es dafür grundsätzlich zwei verschiedene Möglichkeiten.

Zuerst stellen wir jedoch sicher das bereits ein Bucket für Icinga existiert und kopieren die ID für später:

$ influx bucket list
b860eefe6e38c504 icinga infinite 168h0m0s 6533ea60dddd2193 implicit

InfluxQL

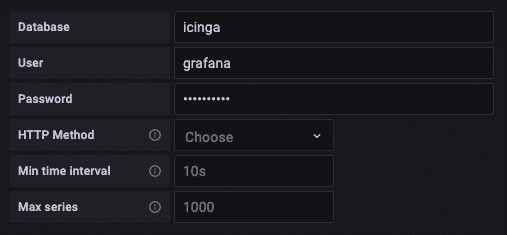
Fangen wir mit der etwas aufwändigeren Methode an. Diese ist nötig wenn man InfluxDB 2 mittels InfluxQL abfragen möchte und geht nur auf CLI-Ebene. Dafür erstellen wir eine v1-Authentifizierung namens „grafana“ mit lesendem Zugriff auf das Icinga-Bucket:

$ influx v1 auth create --username grafana --password ****** --read-bucket b860eefe6e38c504
$ influx v1 auth list

Genau dieser „username“ und das zugehörige „password“ wird dann bei Grafana in der jeweiligen Data Source mit der Query Language „InfluxQL“ als „User“ bzw. „Password“ eingetragen. Zusätzlich geben wir bei „Database“ den Namen des Buckets, in unserem Fall „icinga“, an.

Flux

Für Flux gestaltet sich das Ganze etwas einfacher, da hier die native Authentifizierung verwendet werden kann:

$ influx auth create --description grafana --read-bucket b860eefe6e38c504
$ influx auth list

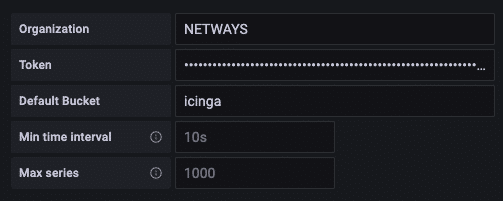
Bei der Data Source mit der Query Language „Flux“ ist dann in Grafana der soeben erstellte lange und kryptische „Token“ einzutragen. Außerdem wird das Bucket, beispielhaft „icinga“, und die Organisation benötigt. Diese wird beim initialen Setup von InfluxDB generiert und lässt sich wie folgt herausfinden:

$ influx org list

Wem das jetzt etwas zu Trocken war, dem kann ich gerne unsere Schulung zum Thema InfluxDB & Grafana nahe legen. Dort wird das im Kontext nochmal anschaulicher erklärt und auch Rückfragen sind natürlich gestattet.

Markus Waldmüller
Markus Waldmüller
Head of Strategic Projects

Markus war bereits mehrere Jahre als Sysadmin in Neumarkt i.d.OPf. und Regensburg tätig. Nach Technikerschule und Selbständigkeit ist er nun Anfang 2013 bei NETWAYS als Senior Manager Services gelandet. Seit September 2023 kümmert er sich bei der NETWAYS Gruppe um strategische Projekte. Wenn er nicht gerade die Welt bereist, ist der sportbegeisterte Neumarkter mit an Sicherheit grenzender Wahrscheinlichkeit auf dem Mountainbike oder am Baggersee zu finden.