Seite wählen

NETWAYS Blog

NETWAYSGrapher V2: From Flash to Flot

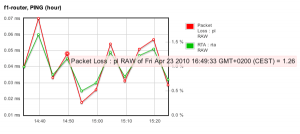
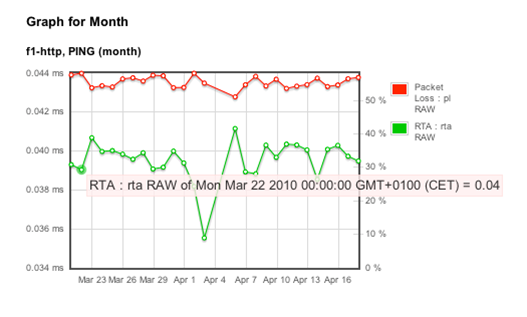
This week we released NETWAYSGrapher V2 2.0.0 with a few significant changes. The most noticeable of all was our switch from Flash based graphs to Java script. Originally a great idea for fantastic, smooth looking charts, zoom interactivity, dynamic multi-graph layering and real-time graphing, we were sad to bid it farewell. But after many attempts to resolve client side browser problems such as burdened CPU performance and slow zoom functionality, we decided that for our Grapher, Flash was just a flop.

That’s when we began our search for suitable libraries. We came upon Google ChartTools, which was pretty impressive with its interactive charts – but its visualisation API was only available through URL request, which was too limiting for our needs.

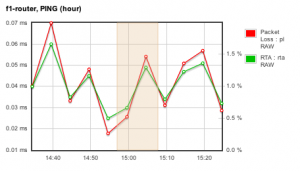
Finally we stumbled across Flot – an open source, Java script plotting library for JQuery. Flot allows us to offer all the same functions we had with Flash – real-time graphing, multi-graph layering, mouse tracking, and zoom interactivity – all with far faster front end and CPU performance. Not to mention the fact that many new devices do not support Flash, relying on HTML instead – we managed to close yet another gap with Flot. Topped off with plugin extensibility, simple and flexible options, Flot was simply the upshot. Cheers to Ole Laursen and IOLA for the great little tool that saved the Grapher.
NETWAYSGrapherV2 Final verfügbar!


Nachdem wir das Release der finalen Grapher V2 Version ja bereits letzte Woche ankündigt hatten, steht die Software nun auf netways.org zum Download bereit. Obwohl wir mit dieser Version schon deutlich hinter dem ursprünglich angepeilten Termin sind, haben wir uns nochmals richtig Zeit genommen, um Installation, Konfiguration und Performance zu verbessern.
Dies spiegelt sich auch in den wichtigsten Neuerungen aus dem Changelogs wieder:

  • verbesserte Installationsroutine
  • hohe Browserkompatibilität
  • Stabilität des Collectors
  • ein neues Gewand in Form von Flot


Das Installationspaket sowie Dokumentation findet man wie immer hier. Wie gewohnt steht die neue Version auch auf dem Demo-System zur Verfügung und kann dort gerne ausführlich getestet werden. Das ein datenbankbasiertes Performancemonitoring auch in großen Umgebungen funktioniert, haben wie bereits auch mit über 15.000 Services erfolgreich testen können.
Also dann, fröhliches Flotten.

Eric Lippmann
Eric Lippmann
CTO

Eric kam während seines ersten Lehrjahres zu NETWAYS und hat seine Ausbildung bereits 2011 sehr erfolgreich abgeschlossen. Seit Beginn arbeitet er in der Softwareentwicklung und dort an den unterschiedlichen NETWAYS Open Source Lösungen, insbesondere inGraph und im Icinga Team an Icinga Web. Darüber hinaus zeichnet er für viele Kundenentwicklungen in der Finanz- und Automobilbranche verantwortlich.