Seite wählen

NETWAYS Blog

OSMC 2018 – Day 1

It is always the same, Winter is coming and it brings people to Nuremberg for OSMC. Our Open Source Monitoring conference still grows every year and after giving three parallel tracks a try last year, we changed format again to include also shorter talks and having always three tracks. It also gets more international and topics get more diverse, covering all different monitoring solutions with speakers (and attendees) from all over the worlds. Like every year also the 13th conference started with a day of workshops enabling the interested ones to get hands on Prometheus, Ansible, Graylog and practical example on using the Puppet modules for Icinga 2. Also this year two days of great talks will be followed by a day of hacking and the second issue of the Open Source Camp takes place, this time focusing on Puppet.
OSMC 2018
And another tradition is Bernd starting the conference with a warm welcome before the first talk. Afterwards Michael Medin talked about his journey in monitoring and being a speaker at OSMC for the eleventh time in „10 years of OSMC: Why does my monitoring still look the same?„. It was a very entertaining talk comparing general innovation with the one happening in monitoring. He was showing up that monitoring solutions changed to reflect the change in culture but still stayed the same mechanism and explained all the problems we probably know like finding the correct metrics and interpreting them resulting from this.
Second talk I attended was „Scaling Icinga2 with many heterogeneous projects – and still preserving configurability“ by Max Rosin. He started with the technical debt to solve and requirements to fulfill when migrating from Icinga 1 to Icinga 2 like check latency or 100% automation of the configuration. Their high-available production environment had no outage since going live in January, because the infrastructure design and testing updates and configuration changes in a staging setup, what is pretty awesome. The scripting framework they created for the migration will be released on Github. But this was not all they coded to customize their environment, they added some very helpful extensions for the operations team to Icinga Web 2, which will be available on Github somewhere in the future after separating company specific and upstream ready parts.
For the third session I had chosen Matthias Gallinger with „Netzwerkmonitoring mit Prometheus“ (Network monitoring with Prometheus). In his case study he showed the migration from Cacti to Prometheus and Grafana done at a international company based in Switzerland. The most important part is here the SNMP Exporter for Prometheus including a generator for its configuration. All required is part of their labs edition of Open Monitoring Distribution (OMD).
After the lunch Serhat Can started with „Building a healthy on-call culture„. He provided and explained his list of rules which should create such a culture: Be transparent – Share responsibilities – Be prepared – Build resilient and sustainable systems – Create actionable alerts – Learn from your experiences. To sum up he tells everyone to care about the on-call people resulting in a good on-call service and user experience which will prevent a loss of users and money.
The Director of UX at Grafana Labs David Kaltschmidt gave an update on whats new and upcoming in Grafana focusing on the logging feature in „Logging is coming to Grafana„. The new menu entry Explore allows to easily querying Prometheus metrics including functions – just one click away – for rate calculation or average and it works the same for logging entries as a new type of datasource. This feature should be very useful in a Kubernetes environment to do some distributed tracing. If you are interested in this feature it should be available as beta in December.
Distributed Tracing FAQ“ was also the title of Gianluca Arbezzano’s talk. I can really recommend his talk for the good explanation on why and how to trace requests through more and more complex, distributed services of nowadays. If you are more interested in tool links, he recommends Opentracing as library, Zipkin as frontend and of course InfluxDB as backend.
This year Bernd’s talk about the „Current State of Icinga“ was crowded and interesting as always. I skip the organizational things like interest in the project is growing according to website views, customers talking about their usage, partners, camps and meetups all over the world. From the technical aspects Icinga 2 had a release bringing more stabilization, improved Syntax Highlighting and as new feature Namespacing. The coming Director release brings support for multiple instances helping with staging, health checks and a configuration basket allowing to easily export and import configuration. A new Icinga Web 2 module X509 helps managing your certificate infrastructure, available next week on github. The one for VMware vSphere (sponsored by dmTECH) is already released and was shown in a demo by Tom who developed it. Icinga DB will replace IDO as a backend moving volatile data to Redis and data to be keeped will be stored to MySQL or PostgreSQL and there will also be a new Monitoring Module for Icinga Web 2 to make use of it, all available hopefully in two weeks.
This year’s OSMC provided something special as the last talk of the first day with an authors‘ panel including Marianne Spiller (Smart Home mit openHAB 2), Jan Piet Mens (Alternative DNS Servers – Choice and deployment, and optional SQL/LDAP back-ends), Thomas Widhalm and Lennart Betz (Icinga 2 – Ein praktischer Einstieg ins Monitoring) moderated by Bernd and answering questions from the audience.
If you want to get more details or pictures have a look at Twitter. There will also be a post by Julia giving a more personal view on the conference from interviewing some attendees and one of me covering the talks of the second day, but now I am heading for the evening event.

Dirk Götz
Dirk Götz
Principal Consultant

Dirk ist Red Hat Spezialist und arbeitet bei NETWAYS im Bereich Consulting für Icinga, Puppet, Ansible, Foreman und andere Systems-Management-Lösungen. Früher war er bei einem Träger der gesetzlichen Rentenversicherung als Senior Administrator beschäftigt und auch für die Ausbildung der Azubis verantwortlich wie nun bei NETWAYS.

NETWAYS Webinare – Aus der Asche

Wer am letzten Webinar zur Icinga 2 Anbindung von Graphite und Grafana teilgenommen hat, wurde Live Zeuge wie sich ein System verhält wenn es faktisch zu heiß ist und einfach seinen Dienst quittiert. Zugegeben, so etwas passiert in der Regel relativ selten. Während eines Webinars ist der Zeitpunkt aber relativ ungünstig.
Wie angekündigt werden wir das Webinar nachholen und zwar am 23. August 2018 um 10:30 Uhr. Die kostenfreie Anmeldung ist direkt hier möglich.
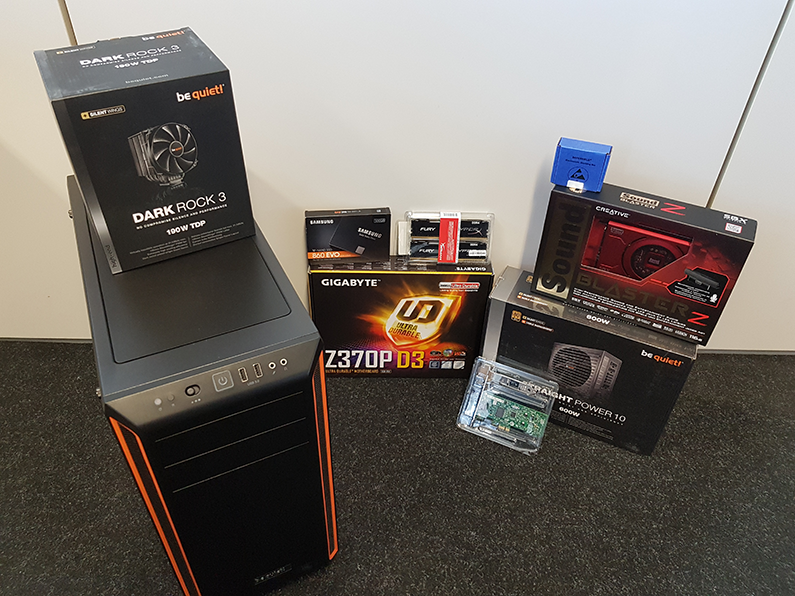
Damit natürlich nicht das selbe Szenario wie beim letzten mal Auftritt, haben wir unser Equipment ein klein wenig aktualisiert.

Somit ist zumindest das Hitze- und Performance Problem kein Hindernis mehr und können entspannt in die Zukunft blicken und die nächsten geplanten Webinare mit Bravur meistern:

Ich freue mich wie immer auf eine rege Teilnahme!

Christian Stein
Christian Stein
Manager Sales

Christian kommt ursprünglich aus der Personalberatungsbranche, wo er aber schon immer auf den IT Bereich spezialisiert war. Bei NETWAYS arbeitet er als Manager Sales und berät unsere Kunden in der vertrieblichen Phase rund um das Thema Monitoring. Gemeinsam mit Georg hat er sich Mitte 2012 auch an unserem Hardware-Shop "vergangen".

NETWAYS Webinare: Icinga 2 Serie

NETWAYS Webinare
Heute möchten wir euch darüber informieren, dass wir uns einige Gedanken über unsere beliebten Icinga 2 Webinare gemacht haben. Anders als bisher wollen wir nicht statisch auf einzelne Themen und Inhalte eingehen, sondern einen ganzheitlichen Eindruck der Möglichkeiten von Icinga 2 vermitteln.
In diesem Zuge werden wir gemeinsam in einer Reihe von Webinaren vom Grundaufbau des Monitorings, der Anbindung an Graphite und Grafana bis hin zum Windows Monitoring und der Integration von Rocket.Chat und Request Tracker für die Alarmierung.
Am Ende der Serie soll als Ziel eine fertige Icinga 2 Umgebung bereitstehen, welche vom Grundaufbau im Rahmen der Webinare erstellt wurde und künftig für weitere Themen bereitsteht.
Die geplanten Termine sind alle direkt auf unserer Webinar Seite zu finden. Eine kurze Übersicht möchten wir trotzdem bereitstellen:

Wir freuen uns wie immer auf eine rege Teilnahme!

Christian Stein
Christian Stein
Manager Sales

Christian kommt ursprünglich aus der Personalberatungsbranche, wo er aber schon immer auf den IT Bereich spezialisiert war. Bei NETWAYS arbeitet er als Manager Sales und berät unsere Kunden in der vertrieblichen Phase rund um das Thema Monitoring. Gemeinsam mit Georg hat er sich Mitte 2012 auch an unserem Hardware-Shop "vergangen".

MSSQL databases from Icinga Web 2

Disclaimer: This guide is only for RedHat and CentOS 7, using the PHP SCL packages with the official icingaweb2 package.
Often when we help customers implement Icinga 2, Icinga Web 2 and Director, they use custom imports to pull in data to their monitoring config. Whenever data is in need to be pulled from a MSSQL database, this can be challenging. Their are multiple guides around the Internet, even from Microsoft.
This post should clear things how to achieve this with the official Icinga packages and their requirements.

Requirements

Basic Installation Icinga Web 2

First of all icingaweb2 and PHP needs to be installed – usually you should have this already…

# on RedHat
subscription-manager repos --enable rhel-7-server-optional-rpms
subscription-manager repos --enable rhel-server-rhscl-7-rpms
yum install https://dl.fedoraproject.org/pub/epel/epel-release-latest-7.noarch.rpm
# on CentOS
yum install centos-release-scl epel-release
yum install httpd icingaweb2
systemctl start httpd.service
systemctl enable httpd.service
echo "date.timezone = Europe/Berlin" > /etc/opt/rh/rh-php71/php.d/timezone.ini
systemctl start rh-php71-php-fpm.service
systemctl enable rh-php71-php-fpm.service

Please also see the official documentation.

MSSQL PDO driver for PHP

Their are multiple ways to install a MSSQL compatible driver, but with icingaweb2 and the ZendFramework below in mind, we need to use pdo_dblib with FreeTDS as driver implementation. I prepared a RPM spec file for you to build and install, it is based on the php-extras packages shipped with Fedora’s EPEL, only updated for PHP 7.1 SCL.
You can setup a small RPM build environment on a RedHat or CentOS machine with the required repositories.

sudo yum install rpm-build rpmdevtools yum-utils gcc gcc-c++ scl-utils scl-utils-build
rpmdev-setuptree
cd ~/rpmbuild/SPEC
wget https://github.com/lazyfrosch/rpm-php-extras/raw/epel7/php-extras.spec
cd ../SOURCES
spectool -gf ../SPECS/php-extras.spec
cd ~/rpmbuild
rpmbuild -bs SPECS/php-extras.spec
sudo yum-builddep SRPMS/rh-php71-php-extras*.src.rpm
rpmbuild --rebuild SRPMS/rh-php71-php-extras*.src.rpm

With the built RPM files under RPMS/ you are good to go to your Icinga machine. Basically you only need to copy rh-php71-php-mssql*.rpm over and install it there.

yum install rh-php71-php-mssql*.rpm
scl enable rh-php71 -- php -m

After restarting php-fpm the driver has been loaded.

systemctl restart rh-php71-php-fpm.service

Patching Icinga Web 2

In Icinga Web 2.5.1 and before there is an error in detecting MSSQL correctly, detection only works in PHP 5.x. A fix has been suggested in PR#3400.
To manually patch this, you only need to fix a single line in /usr/share/php/Icinga/Application/Platform.php

--- /usr/share/php/Icinga/Application/Platform.php.orig 2018-03-27 06:02:59.454240788 -0400
+++ /usr/share/php/Icinga/Application/Platform.php 2018-03-27 00:38:15.967639651 -0400
@@ -351,7 +351,7 @@
 */
 public static function hasMssqlSupport()
 {
- return static::extensionLoaded('mssql') && static::classExists('Zend_Db_Adapter_Pdo_Mssql');
+ return static::extensionLoaded('pdo_dblib') && static::classExists('Zend_Db_Adapter_Pdo_Mssql');
 }
 /**

I hope this helps you getting started, feel free to ask questions in the comments.

NETWAYS offers professional support for Icinga and other Open Source tools, check our Website about Support.
The image used in this article is from johnmartel.blogspot.de, we assume fair use by mentioning the author.

Trick 42 mit dem Director – Jobs in Reihenfolge

Nachdem wir unseren Trick 17 mit dem Director veröffentlichten, schiebe ich Trick 42 direkt hinterher. Wie im Blogpost von Markus beschrieben, sind Schnittmengen aus mehreren Importquellen eine geniale Lösung um beispielsweise Hosts aus mehreren Quellen mit Informationen anzureichern. Konfiguriert man nun eine Vielzahl solcher Importquellen die für die Schnittmenge dienen sollen, bekommt man evtl. im Ablauf gewisse Probleme mit der Reihenfolge.
Zur genauen Erklärung unser Ausgangsszenario:

  • CMDB 1: Quelle für die Basisdaten des Hosts (Name, IP, FQDN, …)
  • CMDB 2: Quelle für den OS-Type (CentOS, OpenSuSE, Debian, …)
  • CMDB 3: Quelle für den Ansprechpartner (Hr. Müller, Hr. Maier, …)

Damit die Hosts aus CMDB 1 angereichert erstellt (Import + Sync) werden können müssen zuerst CMDB 2 und CMDB 3 abgearbeitet werden. Logisch – wenn der OS-Type und der Ansprechpartner des Hosts dem Director nicht bekannt sind wird es mit Hilfe von Trick 17 auch nicht möglich sein den Host aus CMDB 1 mit Daten anzureichern.
Hauptsächlich fällt dieses Problem beim initialen Import + Sync der Daten auf. Je nachdem wie oft sich eure Importquellen ändern kann dies „gar nicht schlimm“ (Hr. Müller ist für den Server 3 Jahre zuständig) oder auch „sehr unglücklich“ (Ihr importiert die Kontaktdaten einer ständig wechselnden Rufbereitschaft) sein.
Für den Fall das die Reihenfolge der Importquellen wichtig ist gibt es eine denkbar simple Lösung.
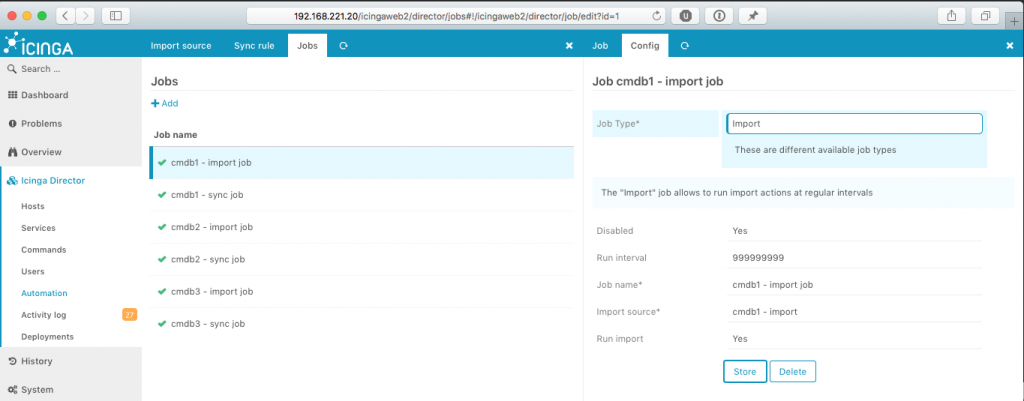
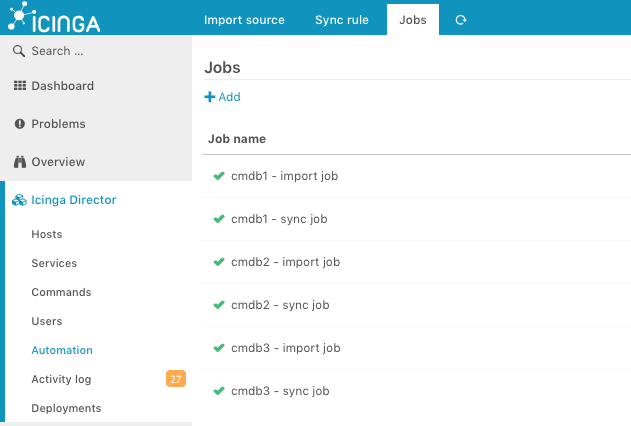
Ihr legt für jeden Import und Sync einen Job im Director an…


…und notiert euch jeweils die ID des Director Jobs (die Zahl an der letzten Stelle der URL).

Mit Hilfe dieser ID könnt ihr nun die im Director konfigurierten Jobs von der Kommandozeile aus ausführen. Der Job mit der ID 1 (Import Job für CMDB1) kann mit dem Kommando „icingacli director jobs run 1“ gestartet werden.
Am Ende bauen wir uns dazu noch ein kleines Skript:
[code]
#!/bin/bash
# set paths and vars
ICINGA_CLI=`which icingacli`
JOB_CMD=${ICINGA_CLI}" director jobs run"
# execute jobs
echo "import and sync…"
echo -e "\tcmdb1"
${JOB_CMD} 1
${JOB_CMD} 2
echo -e "\tcmdb2";
${JOB_CMD} 3
${JOB_CMD} 4
echo -e "\tcmdb3";
${JOB_CMD} 5
${JOB_CMD} 6
[/code]
Und voilà – wir haben die Imports und Syncs in einer Reihenfolge 🙂

Tobias Redel
Tobias Redel
Head of Professional Services

Tobias hat nach seiner Ausbildung als Fachinformatiker bei der Deutschen Telekom bei T-Systems gearbeitet. Seit August 2008 ist er bei NETWAYS, wo er in der Consulting-Truppe unsere Kunden in Sachen Open Source, Monitoring und Systems Management unterstützt. Insgeheim führt er jedoch ein Doppelleben als Travel-Hacker und renoviert, baut und bastelt als Heimwerker an allem was er finden kann.