While preparing for the Icinga OSMC booth and talk, the Icinga developers thought about enhancing the existing Vagrant boxes and include more demo cases. While the icinga2x-cluster boxes illustrate the cluster in a master-checker setup, the standalone box icinga2x focuses on a single Icinga 2 instance with Icinga Web 2 and the Icinga 2 API.
Alongside the Icinga 2 API and Icinga Web 2 there are numerous additions to the icinga2x Vagrant box:
PNP
 PNP4Nagios is installed from the EPEL repository. The Icinga 2 Perfdata feature ensures that performance data files are written and the NPCD daemon updates the RRD files. Navigate to the host or service detail in Icinga Web 2 and watch the beautiful graphs. There’s also a menu entry in Icinga Web 2 providing an iframe to the PNP web frontend on its own.
GenericTTS
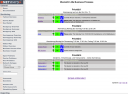
There are demo comments including a ticket id inside the Vagrant box. A simple script feeds them into the Icinga 2 API and the Icinga Web 2 module takes care of parsing the regex and adding a URL for demo purposes.
Business Process
 The box provides 2 use cases for a business process demo: web services and mysql services. In order to check the MySQL database serving DB IDO and Icinga Web 2, the check_mysql_health plugin is used (Icinga 2 v2.4 also provides a CheckCommand inside the ITL <plugins-contrib> already, so integration is a breeze).
These Icinga 2 checks come configured as Business Processes in the Icinga Web 2 module which also allows you to change and simulate certain failure scenarios. You’ll also recognise a dashboard item for the Top Level View allowing you to easily navigate into the BP tree and the host and service details. Pretty cool, eh?
NagVis
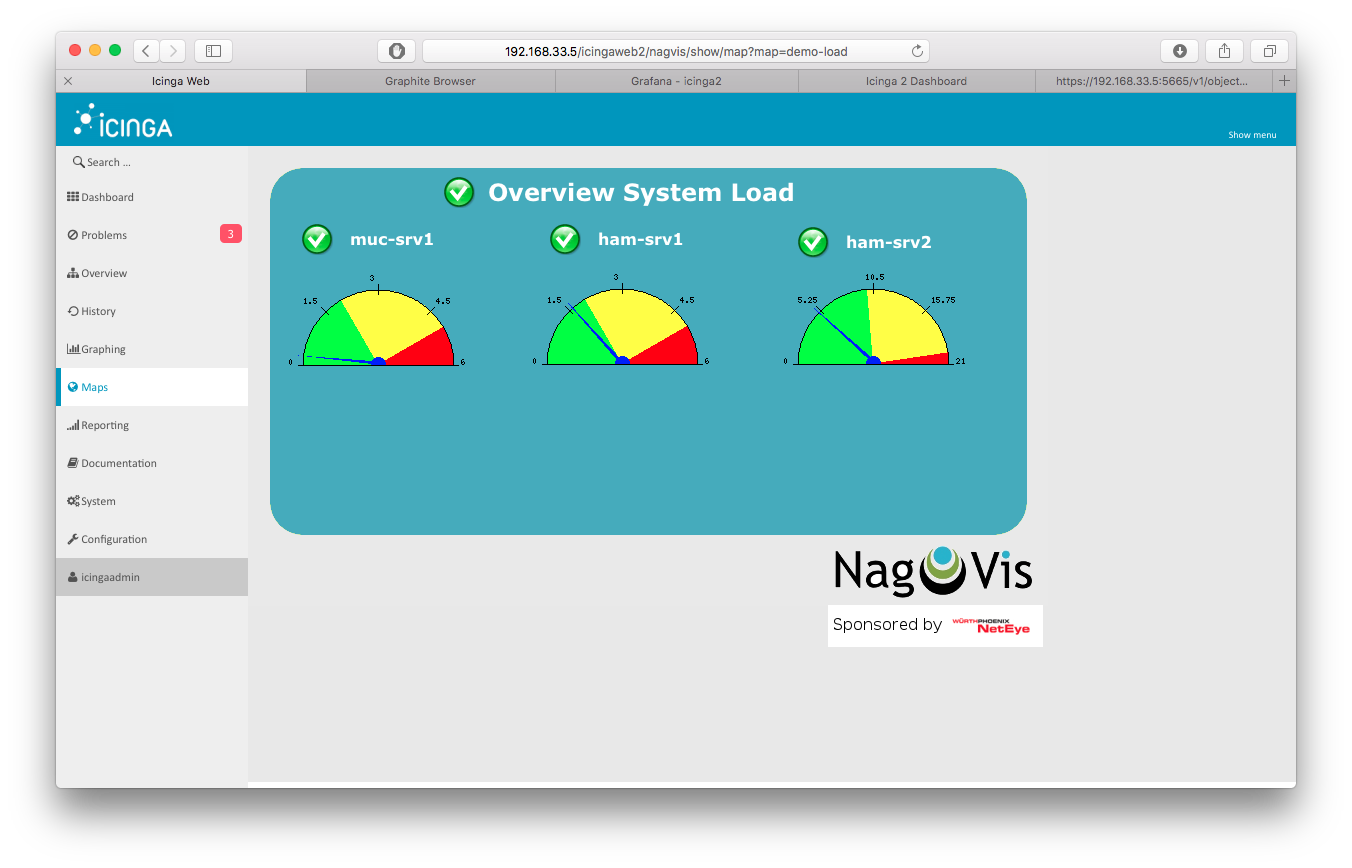
The puppet module installs the latest stable NagVis release and configures the DB IDO as backend. The integration into Icinga Web 2 uses a newly developed module providing a more complete style and integrated authentication for the NagVis backend. Though there are no custom dashboards yet – send in a patch if you have some cool ones 🙂
Graphite
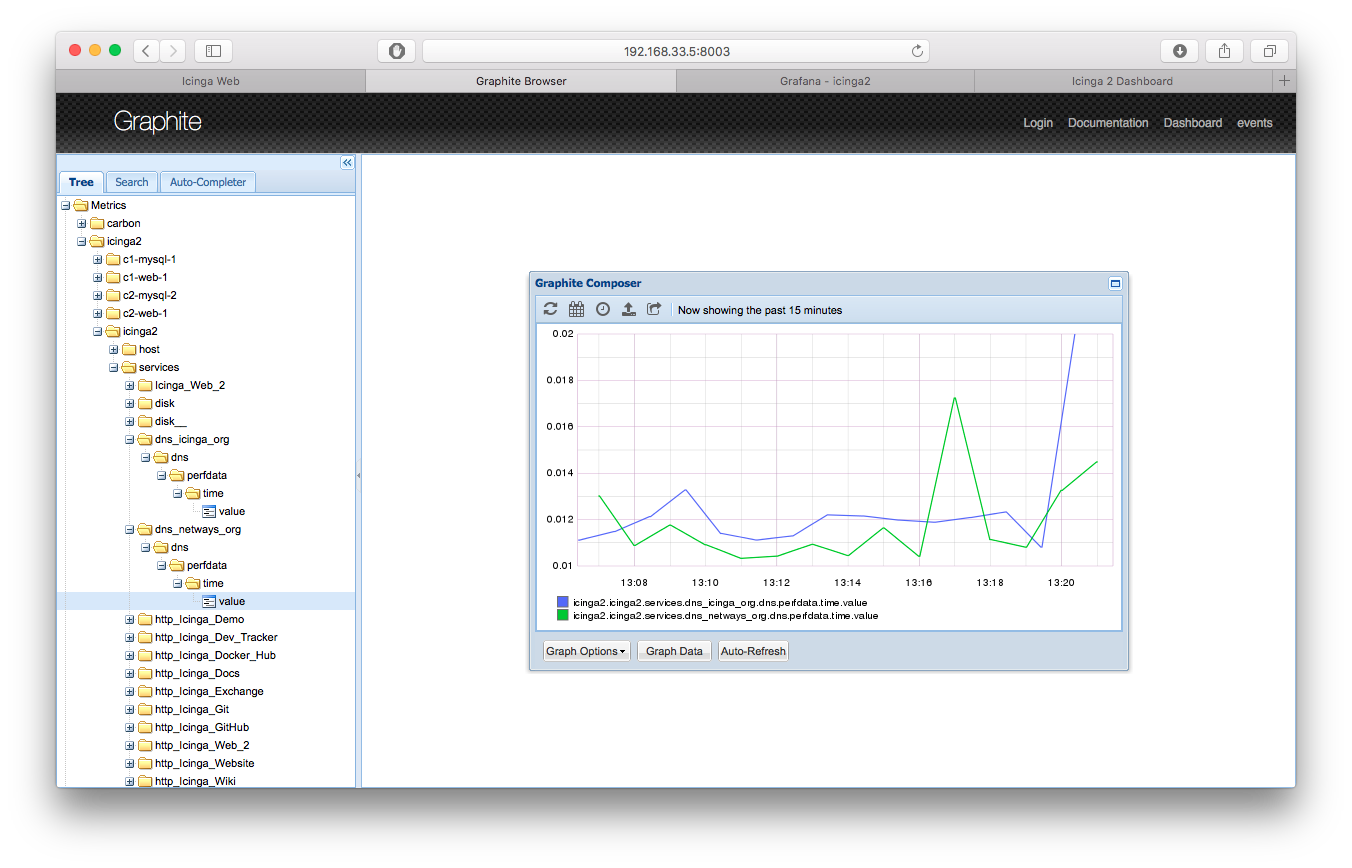
The Graphite backend installation is helped with Puppet modules, the main difference is that Graphite Web VHost is listening on port 8003 by default (80 is reserved for Icinga Web 2). The carbon cache daemon is listening on 2003 where the Icinga 2 Graphite feature is writing the metrics to.
Grafana

Grafana 2 uses Graphite Web as datasource. It comes preconfigured with the Icinga 2 dashboard providing an overview on load, http, mysql metrics and allows you to easily modify or add new graphs to your dashboard(s).
Dashing
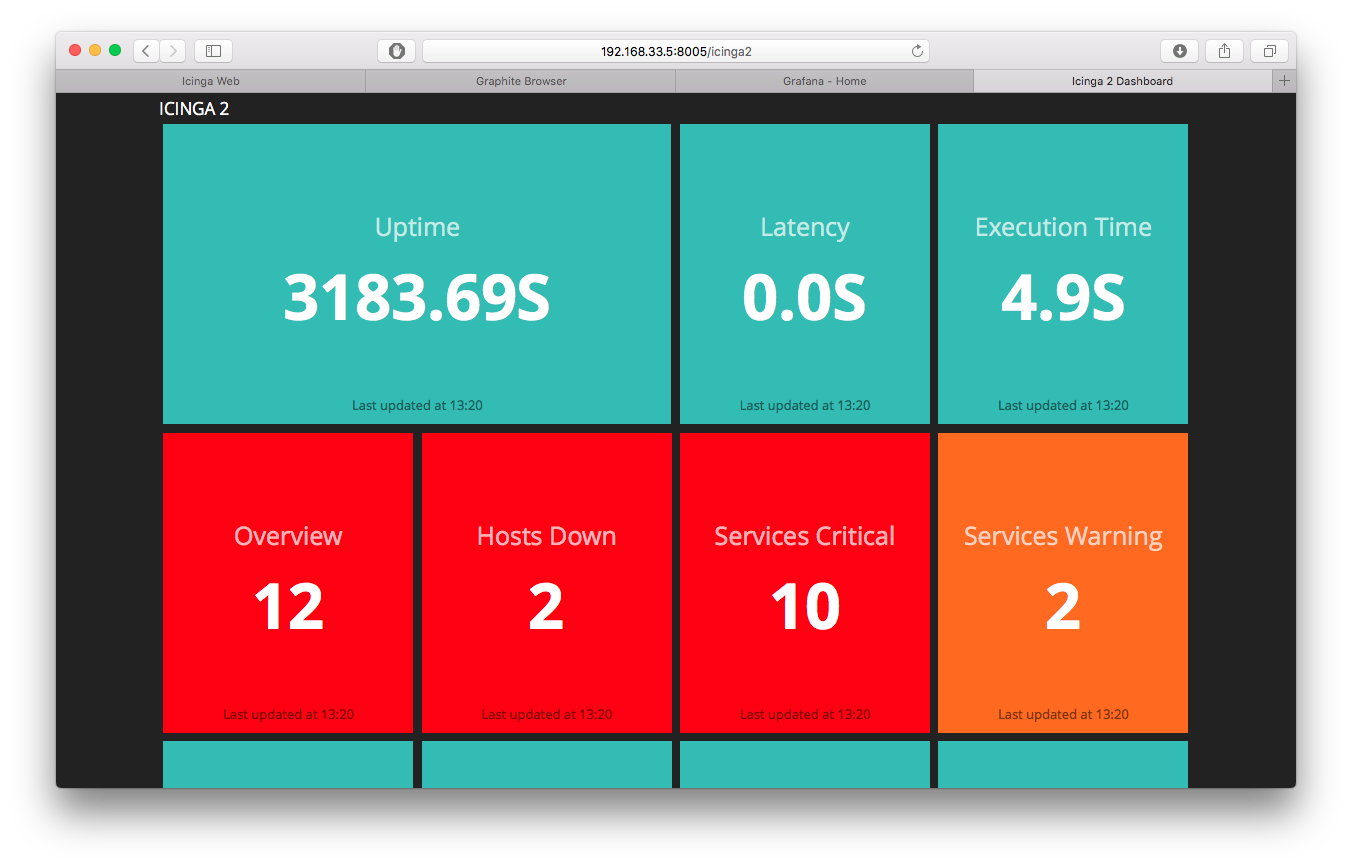
There was a Dashing demo using the Icinga 2 API at Icinga Camp Portland though it required some manual installation steps. Since the Vagrant box already enabled the Icinga 2 API, the provisioner now also installs Dashing and the demo files. Note: Installing the Ruby gems required for Dashing might take a while depending on your internet connection. If Dashing is not running, call `restart-dashing`.
Playtime!
The icinga2x box requires a little more resources so make sure to have 2 cpu cores and 2 GB RAM available. You’ll need Vagrant and Virtualbox or Parallels installed prior to provision the box.
git clone https://github.com/Icinga/icinga-vagrant.git
cd icinga-vagrant/icinga2x
vagrant up
The initial provisioning takes a while depending on your internet connection.
Each web frontend is available on its own using the host-only network address 192.168.33.5:
| Icinga Web 2 | http://192.168.33.5/icingaweb2 | icingaadmin/icinga |
| PNP4Nagios | http://192.168.33.5/pnp4nagios | – |
| Graphite Web | http://192.168.33.5:8003 | – |
| Grafana 2 | http://192.168.33.5:8004 | admin/admin |
| Dashing | http://192.168.33.5:8005 | – |
 Oct 12-16 offered Jasper reporting and J2EE monitoring tips on the NETWAYS Blog for a chill week in both tone and temperature.