Seite wählen

NETWAYS Blog

Flexible and easy log management with Graylog

This week we had the pleasure to welcome Jan Doberstein from Graylog. On Monday our consulting team and myself attended a Graylog workshop held by Jan. Since many of us are already familiar with log management (e.g. Elastic Stack), we’ve skipped the basics and got a deep-dive into the Graylog stack.
You’ll need Elasticsearch, MongoDB and Graylog Server running on your instance and then you are good to go. MongoDB is mainly used for caching and sessions but also as user storage e.g. for dashboards and more. Graylog Server provides a REST API and web interface.
 

Configuration and Inputs

Once you’ve everything up and running, open your browser and log into Graylog. The default entry page greets you with additional tips and tricks. Graylog is all about usability – you are advised to create inputs to send in data from remote. Everything can be configured via the web interface, or the REST API. Jan also told us that some more advanced settings are only available via the REST API.


If you need more input plugins, you can search the marketplace and install the required one. Or you’ll create your own. By default Graylog supports GELF, Beats, Syslog, Kafka, AMQP, HTTP.
One thing I also learned during our workshop: Graylog also supports Elastic Beats as input. This allows even more possibilities to integrate existing setups with Icingabeat, filebeat, winlogbeat and more.
 

Authentication

Graylog supports „internal auth“ (manual user creation), sessions/tokens and also LDAP/AD. You can configure and test that via the web interface. One thing to note: The LDAP library doesn’t support nested groups for now. You can create and assign specific roles with restrictions. Even multiple providers and their order can be specified.


Streams and Alerts

Incoming messages can be routed into so-called „streams“. You can inspect an existing message and create a rule set based on these details. That way you can for example route your Icinga 2 notification events into Graylog and correlate events in defined streams.


Alerts can be defined based on existing streams. The idea is to check for a specific message count and apply threshold rules. Alerts can also be reset after a defined grace period. If you dig deeper, you’ll also recognise the alert notifications which could be Email or HTTP. We’ve also discussed an alert handling which connects to the Icinga 2 API similar to the Logstash Icinga output. Keep your fingers crossed.


Dashboards

You can add stream message counters, histograms and more to your own dashboards. Refresh settings and fullscreen mode are available too. You can export and share these dashboards. If you are looking for automated deployments, those dashboards can be imported via the REST API too.


Roadmap

Graylog 2.3 is currently in alpha stages and will be released in Summer 2017. We’ve also learned that it will introduce Elasticsearch 5 as backend. This enables Graylog to use the HTTP API instead of „simulating“ a cluster node at the moment. The upcoming release also adds support for lookup tables.
 

Try it

I’ve been fixing a bug inside the Icinga 2 GelfWriter feature lately and was looking for a quick test environment. Turns out that the Graylog project offers Docker compose scripts to bring up a fully running instance. I’ve slightly modified the docker-compose.yml to export the default GELF TCP input port 12201 on localhost.
vim docker-compose.yml
version: '2'
services:
mongo:
image: "mongo:3"
elasticsearch:
image: "elasticsearch:2"
command: "elasticsearch -Des.cluster.name='graylog'"
graylog:
image: graylog2/server:2.2.1-1
environment:
GRAYLOG_PASSWORD_SECRET: somepasswordpepper
GRAYLOG_ROOT_PASSWORD_SHA2: 8c6976e5b5410415bde908bd4dee15dfb167a9c873fc4bb8a81f6f2ab448a918
GRAYLOG_WEB_ENDPOINT_URI:
depends_on:
- mongo
- elasticsearch
ports:
- "9000:9000"
- "12201:12201"


docker-compose up

 
Navigate to http://localhost:9000/system/inputs (admin/admin) and add additional inputs, like „Gelf TCP“.
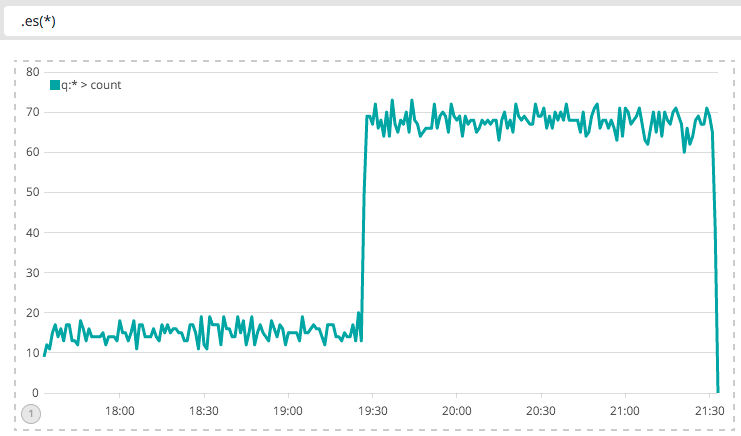
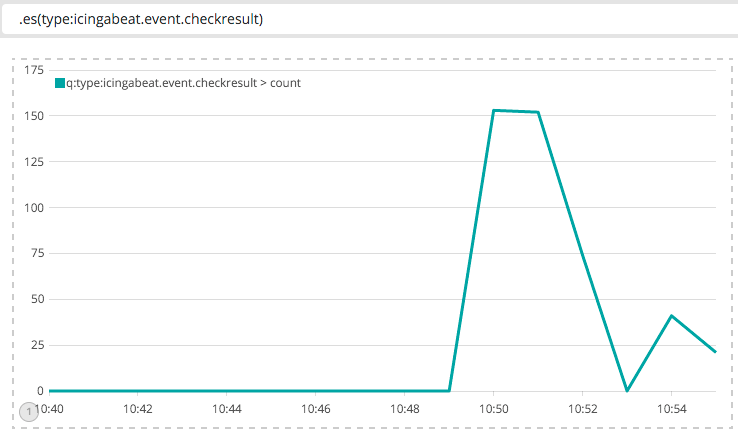
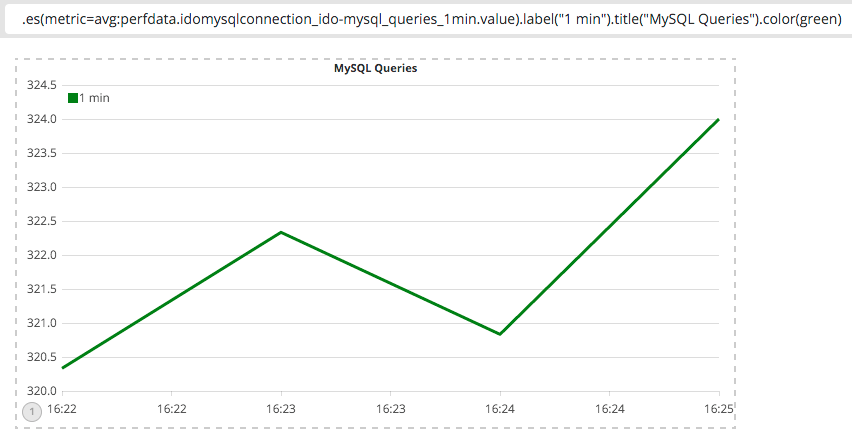
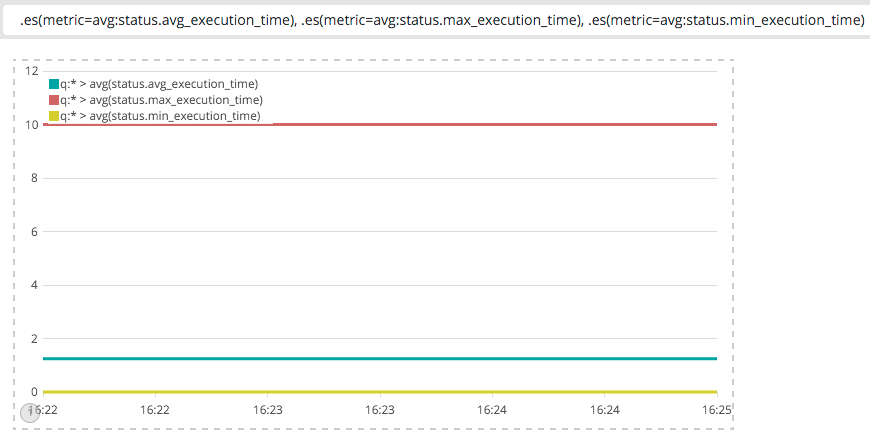
I just enabled the „gelf“ feature in Icinga 2 and pointed it to port 12201. As you can see, there’s some data running into. All screenshots above have been taken from that demo too 😉


More?

Jan continued the week with our official two day Graylog training. From a personal view I am really happy to welcome Graylog to our technology stack. I’ve been talking about Graylog with Bernd Ahlers at OSMC 2014 and now am even more excited about the newest additions in v2.x. Hopefully Jan joins us for OSMC 2017, Call for Papers is already open 🙂
My colleagues are already building Graylog clusters and more integrations. Get in touch if you need help with integrating Graylog into your infrastructure stack 🙂

Timelion, eine Kibana Erweiterung

timelion logoIch habe mich in der Vergangenheit mit verschiedenen Tools beschäftigt die Performancedaten bzw. Metriken speichern und darstellen können. Aktuell beschäftige ich mich näher mit Timelion aus dem Hause Elastic und das hat zwei Gründe: Zum einen wurde mir die Kibana Erweiterung auf der ElasticON letzte Woche wieder schmackhaft gemacht, nachdem ich es eigentlich schon zur Seite gelegt hatte. Zum anderen erweist sich Timelion als sehr nützlich in Verbindung mit meinem Icingabeat. Ein Beat der Daten aus Icinga 2 zur weiteren Verarbeitung entweder an Logstash oder direkt an Elasticsearch schicken kann.
Timelion, übrigens Timeline ausgesprochen, ist eine Erweiterung für das bereits bekannte Kibana Webinterface. Es ist dazu gedacht Daten aus einem Elasticsearch Cluster visuell darzustellen. Anders als die bisherigen Visualisierugsmethoden von Kibana wird bei Timelion aber nichts zusammen geklickt und gefiltert. Stattdessen müssen die eingebauten Funktionen direkt aufgerufen und mit Parametern gefüllt werden. Klingt erst mal kompliziert, nach etwas Übung geht das aber schneller als alles mit der Maus zu bedienen.
Ein Beispiel: Um die Anzahl der Dokumente in Elasticsearch zu zählen, wird die Funktion es() verwendet. Sie erwartet als Parameter eine Query. Mit es(*) werden sämtliche Dokumente gezählt, die Query dabei ist *
timelion default query
Als Query kann alles eingegeben werden was das normale Kibana Interface auch versteht, also Apache Lucene Syntax. Zum Beispiel kann ich die Anzahl der Checkresults darstellen, die mein Icinga gerade ausführt: .es(type:icingabeat.event.checkresult)timelion icingabeat checkresults
Einfach Dokumente zu zählen reicht aber oft nicht aus, insbesondere im Hinblick auf Metriken. Wichtig an dieser Stelle ist der eigentliche Wert von einem Eintrag, nicht die Anzahl der Einträge. Die es() Funktion kann mit ihrem metric Parameter genau das tun. Man muss sich lediglich entscheiden mit welcher Methode man die Daten aggregieren möchte. Auch wenn die Daten nicht in einem definierten Zeitrahmen in Elasticsearch gespeichert werden, müssen sie spätestens bei der Darstellung irgendwie zusammengefasst werden um einen gleichmäßigen Graphen anzeigen zu können. Timelion versucht den Abstand in dem Daten aggregiert werden automatisch zu ermitteln, meistens ergibt das „Sekündlich“. Ob das der richtige Intervall ist, hängt davon ab wie schnell die Daten rein fließen. Wie viele MySQL Queries Icinga 2 innerhalb der letzten Minute ausgeführt hat, lässt sich zum Beispiel folgendermaßen ermitteln:
.es(metric=avg:perfdata.idomysqlconnection_ido-mysql_queries_1min.value).label("1 min").title("MySQL Queries").color(green)timelion icingabeat mysql
Hier sieht man auch das sich mehrere Funkionen aneinander ketten lassen. Zum Beispiel zum setzen von Titel oder Farbe. Timelion bringt eine ganze Fülle an Funktionen mit die die Darstellung der Daten beeinflussen. Ich will nicht alle aufzählen, weitere Beispiele aber sind:

  • bars(): Ein Barchart anstelle einer Linie
  • movingaverage(): Berechnet den gleitenden Durchschnitt
  • min(), max() und sum(): Erklärt sich von selbst

Es können auch mehrere Linien innerhalb eines Graphen angezeigt werden, dazu wird die Funktion einfach mehrfach aufgerufen. Hier ein vergleich der Ausführungszeiten von Icinga Plugins:
.es(metric=avg:status.avg_execution_time), .es(metric=avg:status.max_execution_time), .es(metric=avg:status.min_execution_time) timelion icingabeat execution time
Insgesamt ist das nur ein kleiner Teil dessen was Timelion kann. Auch wenn die Bedienung etwas gewöhnungsbedürftig ist, so kommt man nach etwas Übung schnell rein. Die Graphen die erstellt werden können entweder als eigenständige Dashboards abgespeichert werden oder als einzelne Visualisierungen. Werden die Graphen einzeln abgespeichert können Sie zu Kibana Dashboards hinzugefügt werden. Dadurch ergibt sich eine gute Ergänzung zu den normalen Visualisierungen.

Blerim Sheqa
Blerim Sheqa
COO

Blerim ist seit 2013 bei NETWAYS und seitdem schon viel in der Firma rum gekommen. Neben dem Support und diversen internen Projekten hat er auch im Team Infrastruktur tatkräftig mitgewirkt. Hin und wieder lässt er sich auch den ein oder anderen Consulting Termin nicht entgehen. Inzwischen ist Blerim als COO für Icinga tätig und kümmert sich dort um die organisatorische Leitung.

Diving into Elastic Stack 5.0.0-beta1 and Elastic Beats

logo2_elastic_150x75I’m always trying to look into new devops tools and how they fit best with Icinga 2 as a monitoring solution. Often demanded is an integration with Elastic Stack and Elastic Beats with Icinga 2. Gathering metrics and events, correlated to additional input sources analysing a greater outage and much more.
Last week the first 5.0.0 beta1 release hit my channels and I thought I’d give it a try. The installation is pretty straight forward using packages. Note: This is my first time installing Elastic Stack, still have little knowledge from colleague hero stories and the OSDC talk by Monica Sarbu and earlier conferences.
mehr lesen…

OSDC 2016 – 8th year of glory

Time flies – 8 years Open Source Datacenter Conference (OSDC) already and now the 3rd time in lovely Berlin.
Kicking off with Dawn Foster’s keynote on Open Source – A job and an adventure gave an interesting insight into Open Source careers and living the spirit. As we do at NETWAYS since 1995 inviting everyone onto our journey and happily organising conferences for talks, chats & some drinks together.
And remember …

"be nice" #opensource @geekygirldawn #osdc pic.twitter.com/M8Q5YD9kPv

— Michael Friedrich (@dnsmichi) April 27, 2016


Next up was Kris talking about Another 7 tools for your #devops stack which is always fun to watch. I couldn’t decide whether to join him or go for Mike Elsmore on NoSQL is a lie … though Daniela approached me and said „go for Mike, it is funny“. And so it was in combination with the interesting technical questions asked.

Pikachu 😀 #osdc #awesome @ukmadlz pic.twitter.com/hYU8nY01Li

— Michael Friedrich (@dnsmichi) April 27, 2016


Tough decisions already in the morning – we’re using CoreOS at NETWAYS too and so I could join Jonathan Bulle on rkt and Kubernetes: What’s new with Container Runtimes and Orchestration … or learning something new, moving away from Puppet and learn about Salt – A Scalable Systems Management Solution for Datacenters by Sebastian Meyer.
A pretty hard one also for the presenters as these talks ended right before lunch break – and as you might know already, food is always so delicious at OSDC.

@mjg59 your work featured at the rkt/kubernetes talk at #osdc pic.twitter.com/7NLEGcZvXf

— mika (@mikagrml) April 27, 2016


Finding a place to chill after lunch (oh, it was delicious) should it now be What’s wrong with my Puppet? by Felix Frank or would I go for learning about some monitoring tasks with Hello Redfish, Goodbye IPMI – The Future of System Management in the Data Center with Werner Fischer. I guess I’m more with Puppet these days, less monitoring admin – and the live demo stuff somehow failed but nice to see David Schmitt helping out.

#osdc trolling the demo gods, @felis_rex starts to live-code ruby in the shell pic.twitter.com/Jl4nkEXZjA

— David Schmitt (@dev_el_ops) April 27, 2016


Ever since Elastic announced their Beats toolstack I wanted to learn more about it. I was pretty sad that I couldn’t join Elasticon earlier this year. So I was eagerly waiting for Monica Sarbu telling me more about Unifying Log Management and Metrics Monitoring with the Elastic Beats.

.@elastic #filebeat successor of #logstash forwarder @monicasarbu #osdc /mif pic.twitter.com/uWozj9xx4b

— netways (@Netways) April 27, 2016


Having the Icinga stack in mind with open APIs and such, this shed interesting insights on how to further push integration with Elastic forward. Oh and I definitely need to learn Golang to hack my own beats based on the libbeat library.

I need to learn golang for @elastic #libbeat – sounds awesome thx @monicasarbu #monitoring #osdc pic.twitter.com/TJwi8yDlbr

— Michael Friedrich (@dnsmichi) April 27, 2016


Continuous Integration in Data Centers – Further 3 Years Later with Michael Prokop sounded interesting as well, especially when it comes to Jenkins and Docker integration. Luckily all talks are recorded and made available later in the conference archive so I decided to go for Elastic Beats this time.

Now @mikagrml w/ continuous delivery #osdc 🙂 /mif pic.twitter.com/zbssXyY6U5

— netways (@Netways) April 27, 2016


Martin Schütte gave interesting insights into Terraform: Config Management for Cloud Services. This tool fits into the devops stack HashiCorp has been building over the last years, including Vagrant, Atlas and Otto. MySQL clusters are overly complicated in my (developer) opinion so I didn’t go for MySQL-Server in Teamwork – Replication and Galera Cluster presented by Jörg Brühe. Again one for the archive watchers 🙂

Now Martin Schütte is talking about @hashicorp #Terraform here at #osdc /be pic.twitter.com/Dck11TsW9t

— netways (@Netways) April 27, 2016


ChatOps is becoming more important these days. I’ve already seen Martin’s great talk at Icinga Camp Berlin earlier this year – especially his live demo talking to the Icinga 2 API which makes me a proud developer. ChatOps – Collaborative Communication (or: You cannot not communicate) is definitely something everyone needs to consider and play around with. Especially when it is Open Source.

Keep calm and love APIs #osdc pic.twitter.com/8hhYifp8Mp

— Christoph Mitasch (@CMitasch) April 27, 2016


Heading over from Austria left behind my DNS related past though I’m trying to keep with it. Especially since Jan-Piet is talking about DNS for Developers aka „Everything is a freaky DNS problem“ 😉

.@jpmens with #dns for developers #osdc /mif pic.twitter.com/LsutpiWshu

— netways (@Netways) April 27, 2016

Evening event

Now that we’ve learnt and discussed so much on the first day we are ready for the evening event. This time it located at Umspannwerk Ost which looks nice indeed. Looking forward to delicious food again and later on, some G&T with the OSDC gang 🙂