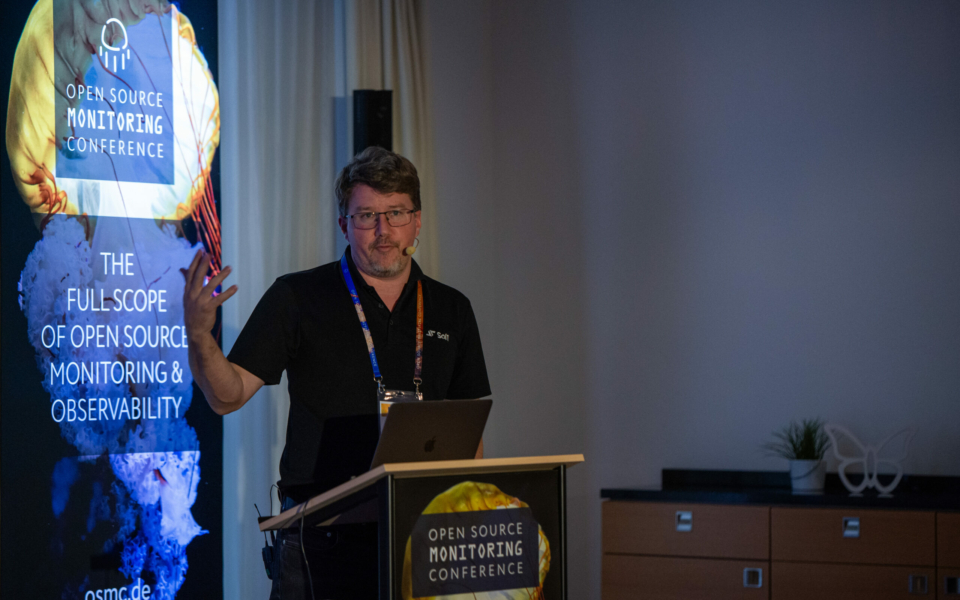
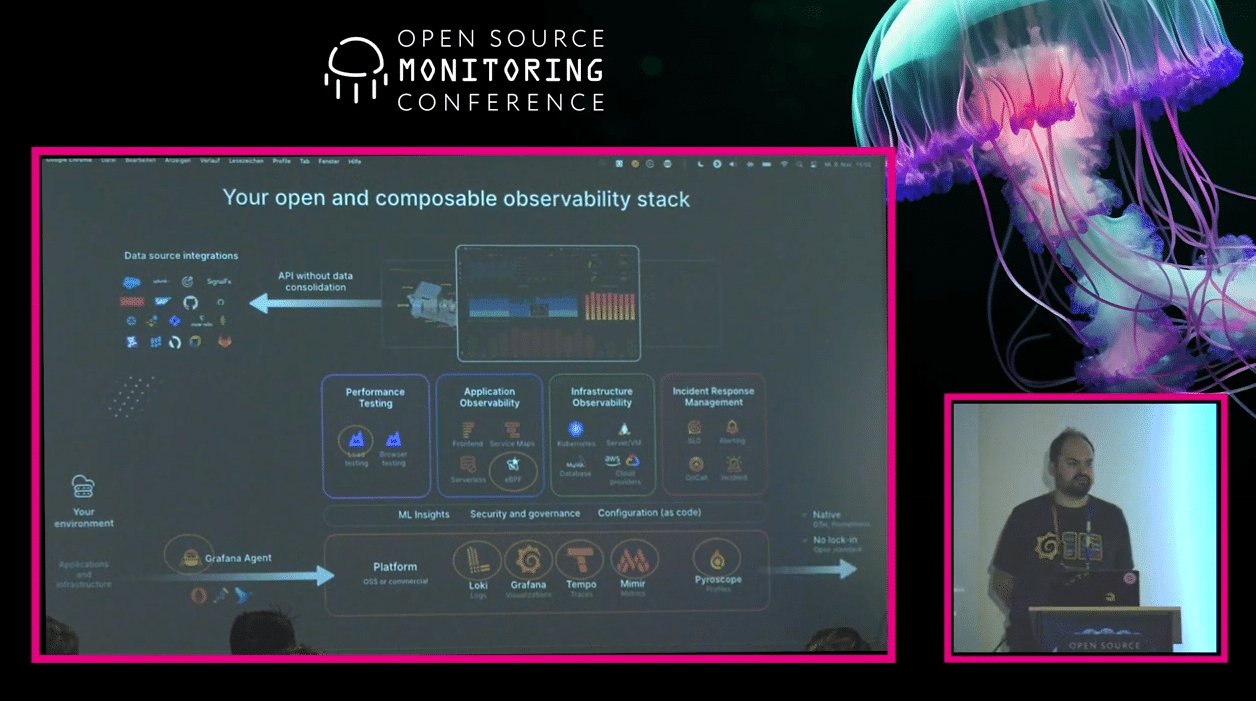
I already mentioned in my recap of this year’s OSMC that I will go into more details about Sebastian Schubert’s talk giving an update on Grafana Labs’s Open Source Observability stack. In fact, I was so interested in the topic I volunteered for this blog post and made our Event team assign me the talk.
You may ask why, so you very likely are one of those who know Grafana very well but have not heard of all the other tools Grafana Labs has added to their stack over the last years. I myself just started a while ago digging deeper into it, and it feels like I can find some gold nugget down there. So I want to spread the word and perhaps cause a gold rush! 😉
Grafana
Sebastian started with a short introduction of him and by asking the audience who knows  Grafana. He was excited for sure that everyone in crowd did know about Grafana. So let’s start with the updates on Grafana. With Grafana being around for quite a while and having become the dashboard solution to go for most people it does not wonder that the most improvements are small but helpful convenience features. His examples were how the empty dashboard and panel editor were improved to help users to get the best representation of their data. Another improvement was the UI helping specifically with writing TraceQL queries instead of just taking an already existing statement which could be hard to come up with.
A completely new thing is the Visual Studio Code integration for editing and previewing dashboards. Looking at the number of colleagues using it, seeing integrating in many other tools as their Web IDE (integrated development environment) and personally thinking it is the best solution developed by Microsoft, having such an integration will make many people happy and grow the user base further.
But Grafana Labs does not only want to grow the user base, they also want to make developer’s life easier by working on a Developer Portal which combines all related information in one place. Please learn a lesson from this if working on a project where it is hard to get all the information needed to get into it!
Mimir
While ![]() Mimir is also around for some time, the metric solution of the stack needs some introduction especially compared to its more well-known competitors. Mimir is the (or one) successor of Cortex and the equivalent to Grafana Enterprise Metrics as an Open Source solution. Something Grafana Labs did with the complete stack, providing an equivalent to its Enterprise solution for the community as true Open Source.
Mimir is also around for some time, the metric solution of the stack needs some introduction especially compared to its more well-known competitors. Mimir is the (or one) successor of Cortex and the equivalent to Grafana Enterprise Metrics as an Open Source solution. Something Grafana Labs did with the complete stack, providing an equivalent to its Enterprise solution for the community as true Open Source.
Mimir was extended and improved over the last year. Most improvements I would summarize as performance enhancement in some way. But there were also new features added like allowing for alerts being sent to Webex or support for Redis as caching solution and Hashicorp Vault for more secure credential storage.
Loki
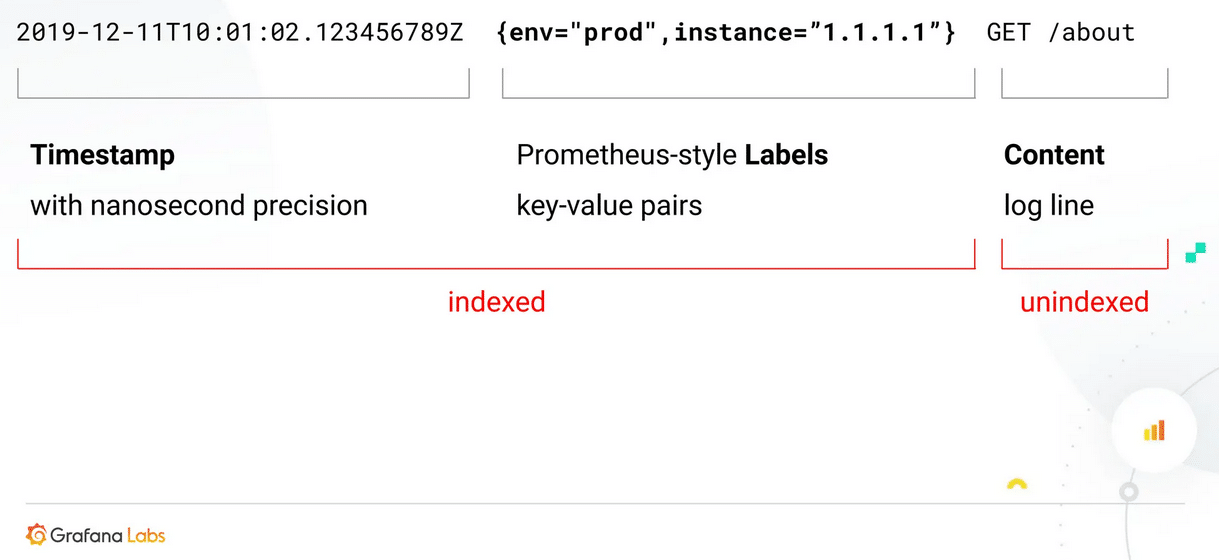
![]() Loki has a similar problem like Mimir. It has more established competitors as log management solutions so it is not known by so many people, but I think it has some advantages you should be aware of. Sebastian did compare it more to Prometheus than its competitors as it uses a similar label-based design. On his format slide he explained this very well that an entry for Loki consists of a timestamp in nanoseconds and labels which get indexed to speed up queries and the not indexed content allowing for post-processing where all other solutions require you to optimize your data for the expected queries already before storing them.
Loki has a similar problem like Mimir. It has more established competitors as log management solutions so it is not known by so many people, but I think it has some advantages you should be aware of. Sebastian did compare it more to Prometheus than its competitors as it uses a similar label-based design. On his format slide he explained this very well that an entry for Loki consists of a timestamp in nanoseconds and labels which get indexed to speed up queries and the not indexed content allowing for post-processing where all other solutions require you to optimize your data for the expected queries already before storing them.
As you may guess post-processing could be the bottleneck in such a design, but Loki has solved this already quite well and Grafana Labs is constantly reducing the resource consumption what made me happy to hear.
Tempo and all the other components
Speaking about  Tempo Sebastian had to increase his at this point of the talk recognizing he can barely fit all the updates from one year for the complete stack in one talk. So starting with the solution for traces he got less into details. Tempo is comparable to the other solutions mentioned earlier but for traces and for this it needs many data.
 Beyla is another tool for tracing with a release pending and very likely to be shown in detail to the public in the near future.
![]() Faro adds Frontend/Browser monitoring to the stack allowing to get details on the real user experience.
Faro adds Frontend/Browser monitoring to the stack allowing to get details on the real user experience.
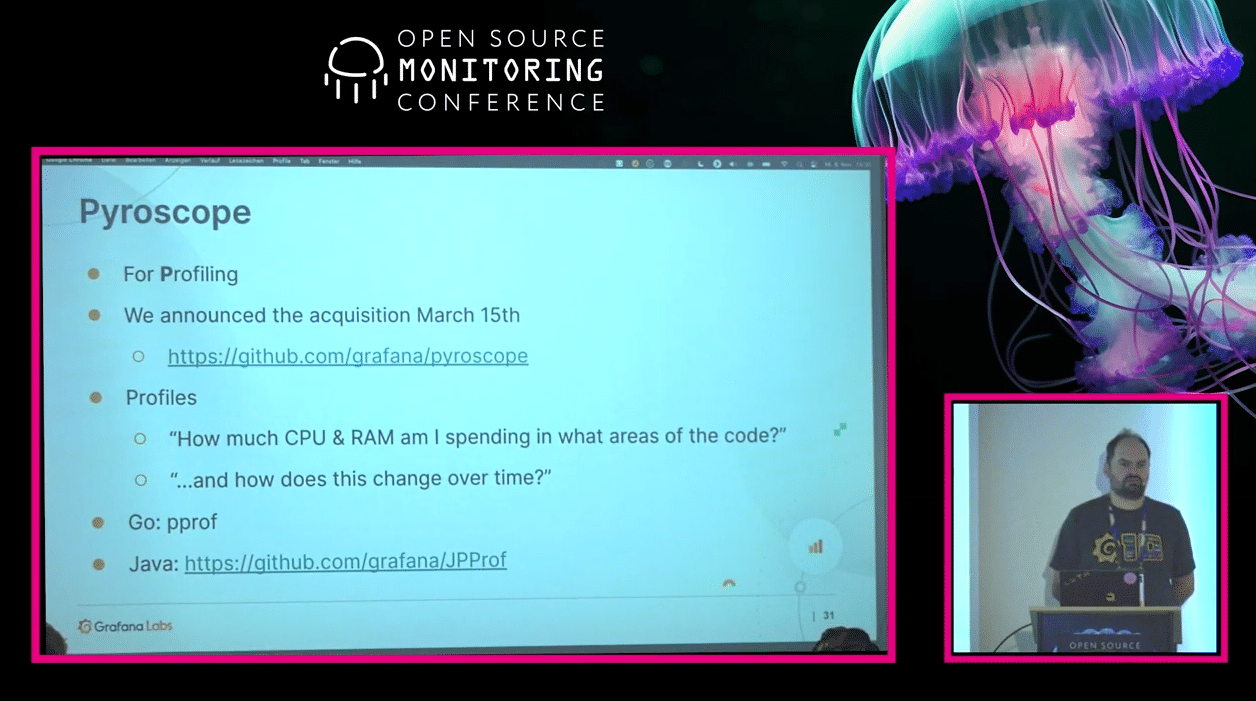
And last but not least  Pyroscope adds profiling which makes the stack cover a very big amount of data. All of those being visualized in the end as a dashboard in Grafana.
So I really recommend at least having a look into the stack and watching the recording of Sebastian Schubert’s talk „What’s new with Grafana Labs’s Open Source Observability stack“ is a good starting point for this! Another starting point could be our training on InfluxDB & Grafana.
We hope to see you around at OSMC 2024! Stay in touch and subscribe to our Newsletter!