Seite wählen

NETWAYS Blog

How I met your C2 : Basic Operational Security for Defense and Offense

Throughout this blogpost I want to share some awareness on search engines and current trends of fingerprinting. Some parts have tags for defense and offense. In the following Black Hats are considered evil and destructive, whereas Red Teams simulate Black Hats, allowing organizations to test their effective defenses by Blue Teams.

Warning: Make sure to follow your countries jurisdiction on using Shodan and Censys. In most countries querying keywords is not an issue for public available data, as it is public and has been harvested and tagged by the search engine itself already. This is just like google dorking something like Grafana intitle:Grafana – Home inurl:/orgid, private Keys: site:pastebin.com intext:“—–BEGIN RSA PRIVATE KEY—–“ , or AWS Buckets: site:http://s3.amazonaws.com intitle:index.of.bucket .

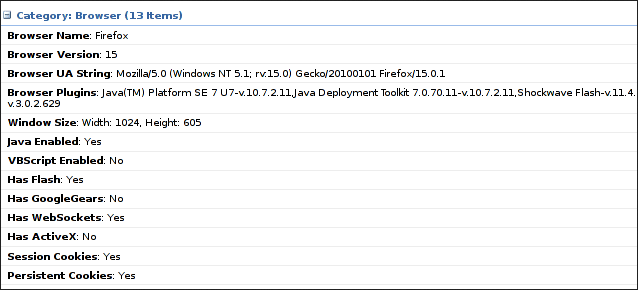
Browser fingerprinting & custom malware

Sites like amiunique directly show how WebGL and other metadata tracks us. This is why TOR disables Javascript entirely and warns you about going fullscreen.

Offense:

Beef  and Evilgophish would be two OSS frameworks for fishing and victim browser exploitation, which have profiling included.

Defense:

You could use:
1) User Agent Spoofer for changing your Operating System
2) Squid in Paranoid Mode, to shred as many OS & hardware details as possible
3) Proxychains with Proxybroker to collect and rotate IPs. KASM allowing containerized throw away workspaces would also throw many attackers off conveniently.

Infrastructure tracking

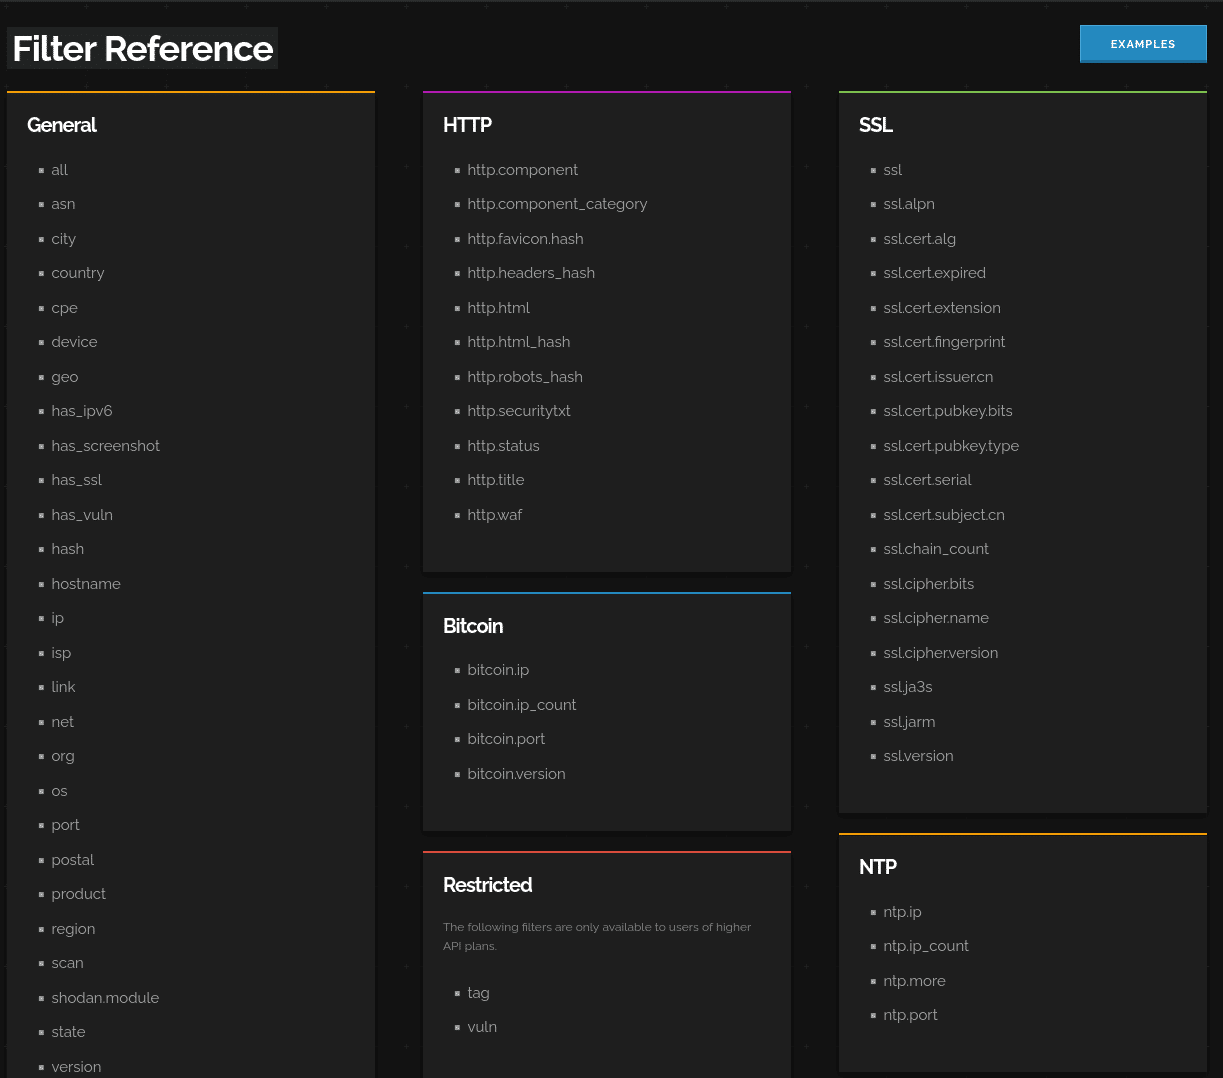
Shodan has a list of filters to set, depending on your payment plan. Often advanced payment planes are not necessary (but you are limited to a number of queries/day), more so the correct hashes and keywords.

Recently Michal Koczwara a Threat Hunter, shared some great posts on targeting Black Hat infrastrastructure.

JARM TLS Fingerprinting

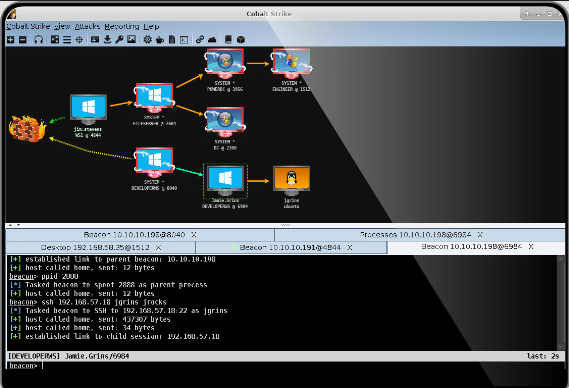
Firstly, what is a C2? It is a Command & Controll server that has Remote Code Execution over all the malware agents. Cobalt Strike is one of the top two C2 for Red Teamers and Black Hats. An analogy to monitoring would be an Icinga Master, which has visibility, alerting & code execution over multiple monitoring agents.

Defense:

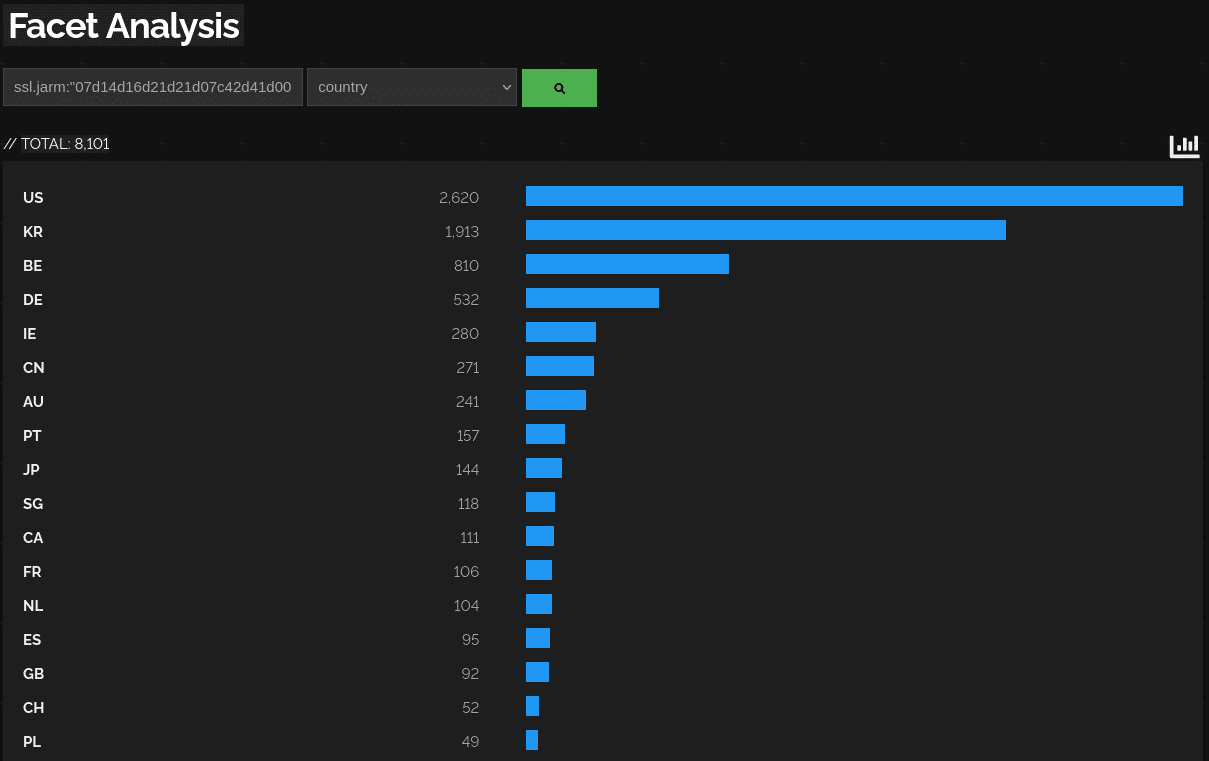
Salesforce JARM is an amazing way to fingerprint the TLS handshaking method. This is because a TLS handshake is very unique, in addition to bundled TLS ciphers used. A basic Shodan query for this would be: ssl.jarm:“$ID-JARM“. Of course C2 developers could update their frameworks (but most don’t).

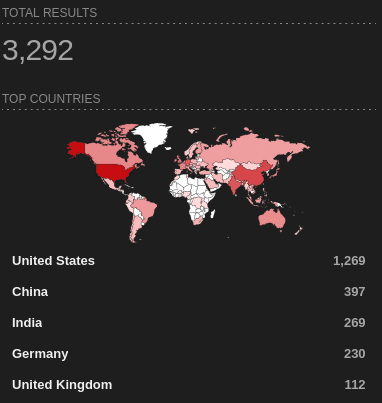
Below you see a query of Cobalt Strike JARM C2s and the top countries it is deployed in. Of course servers are individually visible too, but at this point I try to not leak the IPs.

.

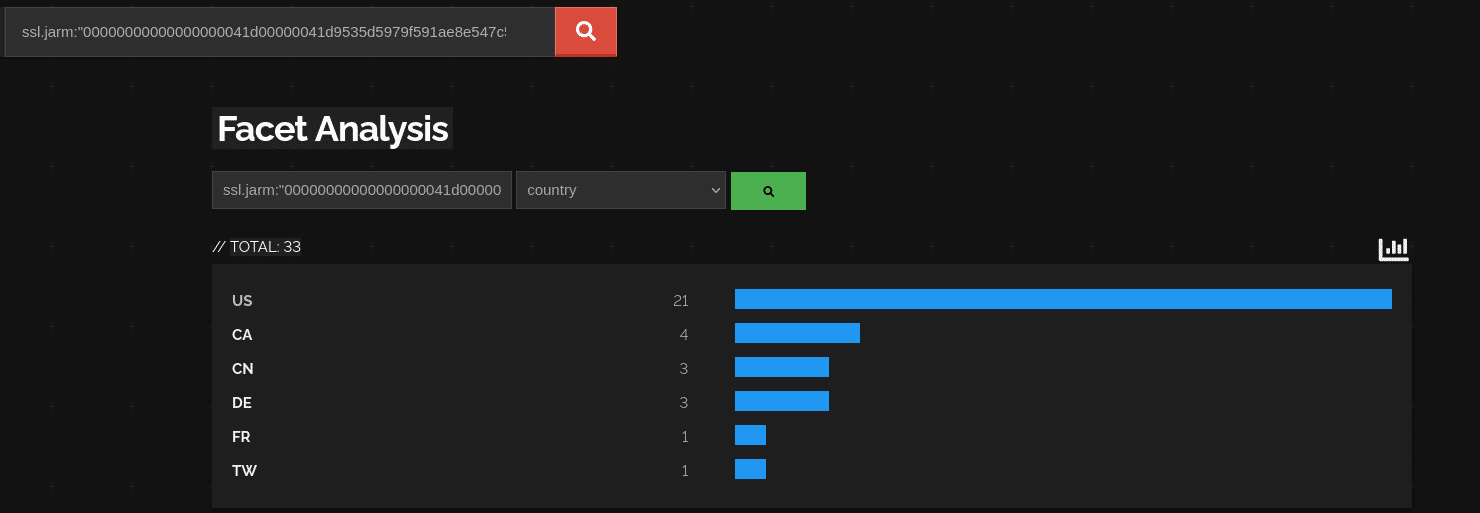
This also works for Deimos C2, or any other C2.

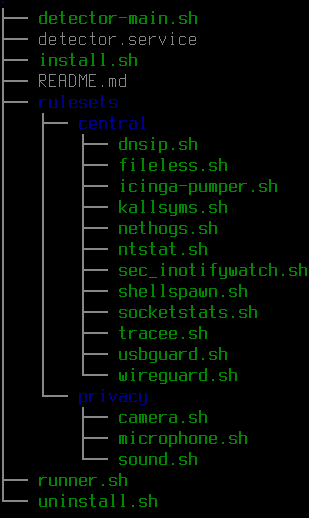
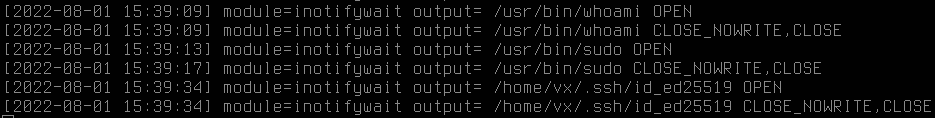
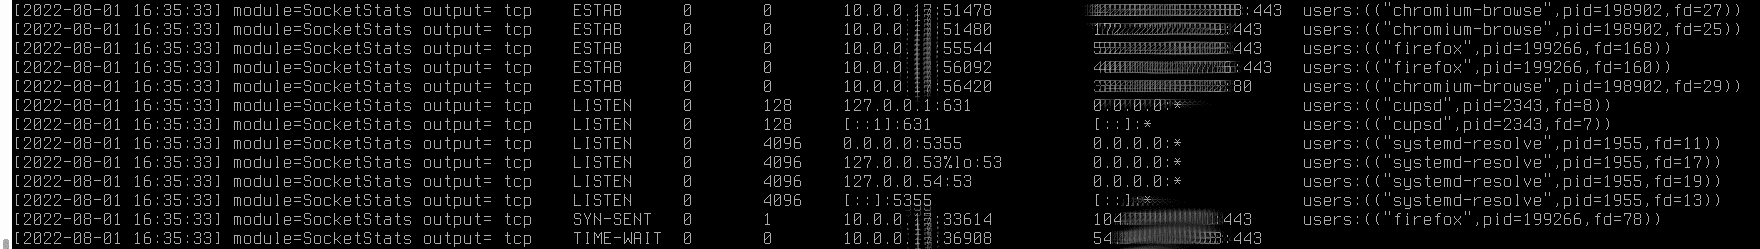
You can find various lists of JARM hashes, and all you need to do is run JARM against an IP and port, to create your own lists. This could scale greatly tcpdump, Elastic or my little detector collecting IPs, and alert on the very first TCP connection (basically on the first stager phase of the malware, before any modules are pulled off the C2).

Offense:

Put your C2 behind a proxy, make sure to select a good C2 for operational security, and add randomization for the JARM.

Http.Favicon Hashes

For Favicons: Use Hash Calculators like this one here. This is quite common in bounty hunting to avoid Web Application Firewalls if the server has internet access without a full WAF tunnel. A basic Shodan query would be look this: http.favicon.hash:-$ID.

Http.html Hashes

There are even more OSINT indicators like those ones by BusidoUK which show http.html hashes impact on Metasploit http.html:“msf4″ or Miners http.html:“XMRig“. Some Black Hats or Red Teamers don’t even bother to put any authentication on their C2s at all?


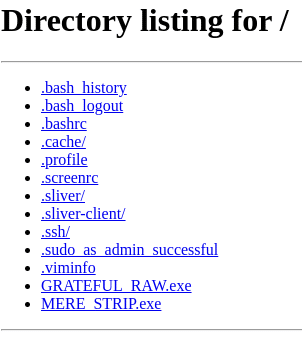
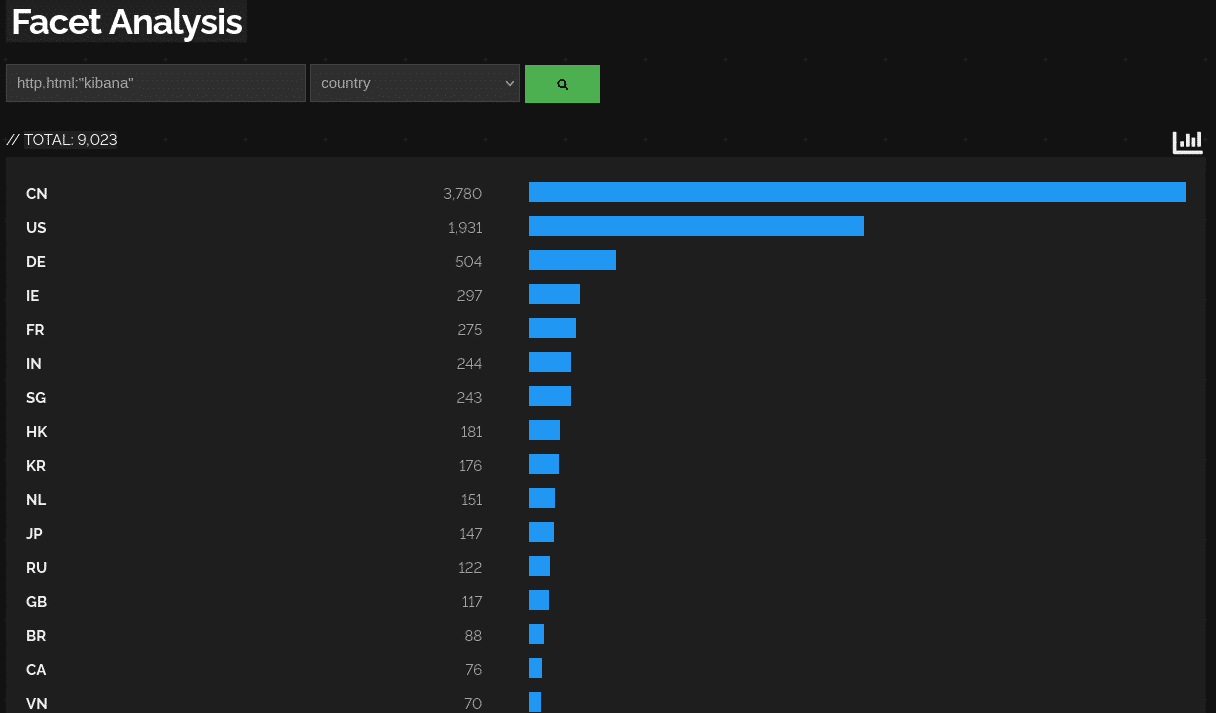
Http.hml Hashes are brutal! You even find literally anything online, even defensive products like Nessus http.html:“nessus“

or Kibana http.html:“kibana“.

Fingerprinting Honeypots

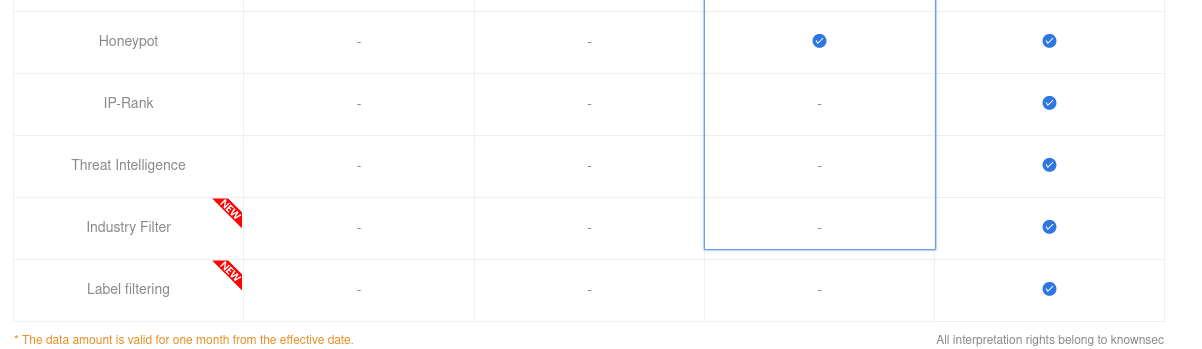
Interestingly the chinese Version of Shodan, Zoomeye, is also offering fingerprinting honeypot detection in the VIP and Enterprise models. Some honeypots should really work on their Opsec, but of course this is an expensive cat and mouse game, and pull requests are always welcome right.

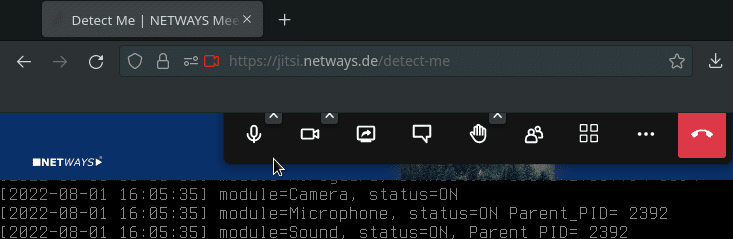
As of now I am diving more into honeypots with Elastic backends, and even complete Active Directory Honeypots, to help you as our customers more in the future.

In case you’re interested in consultancy services about Icinga 2, Elastic or another of our supported applications feel free to contact us at any time!


OSMC 2022 | AI Driven Observability based on Open Source

Observability and monitoring of resources are growing every day and it is inevitable to analyse all the data points to arrive at a solution. At Mercedes-Benz they have developed an Open Source data metric analyzer and drive it with data science to identify anomalies. At OSMC 2022, Satish Karunakaran, a data scientist with 19 years of experience in the field, presented how they established the entire data processing ecosystem based on Open Source.

In the beginning of his talk, Satish immediately questioned how much value can be generated manually out of Big Data, since metrics, logs and traces all provide intelligence. His point was not about scalability, management (manual patching) versus unmanaged (self-healing) here, but how to optimize for prediction and detection of failures.

Following up, the question arose what is normal, and how to determine normality versus abnormality.


Especially cases of „looks normal, but not sure“ or „better than last week, but something is wrong“ could be optimized with a data driven approach.

The idea is the following: 1) Collect lots of functional & correct data (as much as possible, as long as possible). 2a) Use lots of nested if conditions: Check if a value / limit ( 3 < 5 = yes ) has been reached, and if so, get more and more granular ( 3 < 4 =yes ) and split up based on previous choices (3 < 3 = false). This is also called a decision-tree. 2b ) Create labelling tags. 2c) Make this process highly parallel via scalable, distributed, gradient-boosted decision trees (XGBoost).

Boosting comes from the idea of improving single weak models by combining them with other weak models, in order to generate a strong model! Gradient boosting is an improved supervised learning variant if this, which takes labeled training data as input, and tries to correctly predict each training example – to label future data.

TLDR: If we know what is healthy, because if we have lots of healthy data, and are able to labelpredict each next data point to the real world (not necessarily watching what is happening, but predicting what will happen), and suddenly our predictions do not match, then we have an abnormality and should call an alert! Or, if you prefer to watch an AI explain XGBoost:

This morning I came across a cool demo by @LinusEkenstam about creating animated AI-generated characters. I decided to give it a try, and, with slight modifications, this is what I ended up with. pic.twitter.com/e2vx9OP0Ls

— Bojan Tunguz (@tunguz) January 18, 2023

Unfortunately compared to Neural Nets, XGBoost appears slow and memory intense with many decision-branches, wheares Neural Nets allow scalability and optimization – due to being able to optimize and drop for hidden functions. Additionally, one tries to converge for the maximum (XGBoost), and the other tries to converge for the minimum (Neural Nets). So combining both and getting the best possible tag tag-prediction is the art of someone who does this for quite a long time, like Satish!

An example of how Satish and his team implemented this can be seen in this picture, which displays the path of data flow, data orchestration and visualization.

Do you think all monitoring should follow an AI based anomaly approach?

Would you find it cool if all monitoring solutions one day would have predictive models? And how would they deal with statistical outliers? Maybe lots of human time wasted could be saved, if we could focus on „the essentials“? Would you like to hear more about about data science & AI at further NETWAYS Events or like to talk to Icinga developers about this fascinating topic? Please feel free to contact us!

The recording and slides of this talk and all other OSMC talks can be found in our Archives. Check it out! We hope to see you around at OSMC 2023! Stay in touch and subscribe to our Newsletter!

OSMC 2022 | The Power of Metrics, Logs & Traces with Open Source

In his talk at our Open Source Monitoring Conference OSMC Emil-Andreas Siemes showed how organisations can drastically reduce their MTTR (Mean Time To Repair) by using, integrating and correlating the Open Source tools Mimir, Loki & Tempo. He also talked about Open Source reliability testing to even avoid problems in the first place. And yes, with the use of Grafana. The moment Emil asked the crowd who uses Grafana, and I looked around, almost every single hand in the entire conference room was up.

Essentials on the Grafana Stack

Today Grafana labs employs over 1000 employees, improving observability. The core projects to pull this off are:

The Grafana Stack is also known as LGTM: Loki for logs, Grafana for visualization, Tempo for traces, and Mimir for metrics. In addition they employ 44 % of Prometheus maintainers, and provide the Grafana Mimir long term storage.

Grafana Faro

Emil emphasized the importance of OpenTelemetry which a standard for traces, metrics and logs (including metadata) and the way Tempo (traces) and Loki (log ingestion & aggregation) work together with Mimir. Another important point of the talk was a new way how Grafana Faro, an Open Source web SDK is able to provide frontend application observability!

Emil showed a Faro demo, and webvitals such as TTFB, FCP, CLS, LCP, FID were able to be picked up. This might be something very interesting for web and app developers in the future to improve and monitor their applications.

Improvements to Loki

Finally Emil discussed improvements to Loki, whose performance was significantly improved by 4x faster queries, and 50% less CPU power. Then LogQL was discussed and examples for Log & Metrics queries were shown, which should be quickly picked up by those familiar with PromQL.

Helping you get more observability

Overall the talk was a great way to get introduced and updated on the Grafana ecosystem. In case you need help to provide visibility and scaling to your ecosystem, at NETWAYS we provide consulting for integrating Grafana into your infrastructure. Feel free to contact us, and see you at the next event!

The recording and slides of this talk and all other OSMC talks can be found in our Archives. Check it out! We hope to see you around at OSMC 2023! Stay in touch and subscribe to our Newsletter!

Detector OSS IDS: How to Shellscript Your Own Little Free Intrusion Detection System

Today I’ll show you a side project I’ve been working on the past month to defend my personal systems and practice shell-scripting and forwarding logs. It is just a proof-of-concept that is work in progress. I have decided to share my project, because Open Source = Open World! You can find detector here on Github.

This small project follows 3 basic goals: a) minimal b) trustable c) modular & customizable:

  • Required Binaries for Checks: AWK, SED & GREP (en masse), Inotify-Tools, Tracee, TS, USBGuard, SocketStats, Dialog, (Nethogs)
  • Just run the ./install.sh or ./uninstall.sh
  • Comment or uncomment the execution of the scripts/modules in the central/privacy directories as you like

How it basically works:

– Runner: Create a 1) Systemd service with a timer, calling a 2) Watchdog with a timer, 3) calling a main (separating Operating Systems and module choices), 4) calling the modules

– Modules: 5) run checks 6) grep for exit codes  6) append a time-stamp 7) append a module tag (with a possible KV – filter for Logstash-Pipelines) ->> write to detecor-logfile | Optional:  9) output to Elastic (via Filebeat -> Logstash-Pipelines) 10) output to Icinga 2 (via passive-checks for more logic & free alerting)

Detector currently (2022/08/01) covers:

Dropping & tracking honeypots via inotifywait:

Tracking USBGuard:

Checking Camera & Microphone Activation:

Tracking Shells and Sub-Shells:

Tracking Established and Listening Sockets with their relevant Programs and PIDs, plus provided DNS-Servers and Wireguard:

Using Tracee from Aquasecurity with 4 cool flags: TRC-2 Anti-Debugging , TRC-6 kernel module loading, TRC-7 LD_PRELOAD, TRC-15 Hooking system calls:

Tracking Kernel-Symbol counters for changes on module export tables:

Now we can be happy, but why not send it to Elastic and do some more magic there?

Or add even more logic and alerting via Icinga 2! (All we have to do is create a template for a passive check, apply the passive check over a (Linux)-hostgroup and set up an API-User with the „actions/process-check-result“. Our icinga-pumper.sh POC Code gets automatically executed in the $central directory, and we save ourselves the Icinga 2 agent installation, while Icinga 2 authentication happens over a certificate deployed via Nextcloud or the likes. :

TrippleCross and badbpf are some very cool offensive projects with eBPF implants I’ll try to understand and study until the next blogpost. See you by then!

If you want to learn from the people that tought me to pull such a side-project off, mostly Dirk and Thomas, then come and join us!

Proxmox Routed NAT für die NWS Openstack Cloud, Hetzner uva.

Warum Proxmox? Weil Du damit einen robusten AGPL3-Lizenz basierten, sicherheits- und privacy-technisch (Debian) unbedenklichen, KVM-Hypervisor bekommst, der Out-of-the-Box LXC kann, was extrem ressourcenfreundlich ist, und Du damit wie gewohnt Deine Linux-Befehle abfeuern und automatisieren kannst.

Unter Debian befinden sich die direkt greifenden Kern-Netzwerkkonfiguration unter /etc/network/interfaces und nachfolgender Teil basiert darauf. Auskommentierte Parameter werden wie gewohnt durch # dargestellt – an einigen Teilen habe ich Parameter auskommentiert gelassen, die aber zum Testen & Debuggen wichtig waren und die ich auch für Zukünftiges oder Nachzuschlagendes nicht verstecken möchte.

Bridged-Home

Eine default Proxmox Konfiguration für Zuhause sieht z.B so aus:

[bash language=“language“]
auto lo
iface lo inet loopback

iface ens3 inet manual

auto vmbr0
iface vmbr0 inet static
address 10.77.15.38/24
gateway 10.77.15.254
bridge-ports ens3
bridge-stp off
bridge-fd 0
[/bash]

Erklärung: Wie Du siehst läuft alles über einen virtuellen Netzwerkadapter vmbr0, der IP & Gateway behandelt: das eigentlich echte Interface ens3 wird hier nur auf manual geschalten, während das vmbr0 auf static gesetzt ist. Dieses vmbr0 Interface wirst Du auch pro VM / LXC -Container dann jeweils auswählen, und eine passende IP vergeben bzw. vergeben lassen. Beachte allerdings den Punkt bridge-ports ens3 , machst Du so etwas bei einem externen VPS/Bare-Metal Provider, musst Du eventuell zusätzlich eine gekaufte virtuelle MAC mitgeben – oder könntest offline genommen werden, da nun über mehrere MACs mehrere reelle IPS laufen würden, wo die Sicherheitsfeatures des Gateways des Providers Alarm schlagen sollten. Daher folgender Routed-NAT Ansatz:

Routed-NAT in der Cloud

Metadata

Hinweis: Nachfolgendes im OpenStack mit Metadaten ist minimal hacky, aber es „tut“, ob Du so etwas in der Production benutzen willst ist Dir überlassen. Bei LXC-Containern wirst Du genauso Performanz haben wie nativ in Deiner Instanz da diese CGroup basierend sind.

Willst du maximales Vertrauen und maximale Sicherheit nimmst Du Dir eine eigene Proxmox ISO und lädst diese hoch – was bei NWS kein Problem ist: Noch besser, Du lädst ein eigenes Debian 11 Bullseye hoch, installierst und verschlüsselst dieses, und installierst Proxmox on Top.

Nach dem Hochladen der ISO findest Du die Möglichkeit Metadata-informationen anzupassen, um die VM im Openstack Hypervisor auf  Virtualisierung einzustellen. Nachfolgende Flags zu setzen hat für mich funktioniert:

Du kannst nun Deinen Server hochfahren, und kannst danach nach dem Booten, über „Console“ die Installation starten. Du solltest im Anschluss das Boot-ISO unmounten, sonst kommst du nach dem Reboot wieder zur Installation, tust Du es nicht, kannst Du aber auch einfach über Rescue-Shell die Proxmox-Instanz starten. In meinen Tests wurden DHCP und Gateway automatisch angezogen und die Installation lief problemlos durch.

Proxmox Routed-NAT Konfiguration

[bash language=“language“]
auto lo
iface lo inet loopback

auto ens3
iface ens3 inet static
address 10.77.15.38/24
gateway 10.77.15.254
# pointopoint 10.77.15.254

auto vmbr0
iface vmbr0 inet static
address 10.77.15.38/24
netmask 255.255.255.0
gateway 10.77.15.254
bridge-ports none
bridge-stp off
bridge-fd 0
pre-up brctl addbr vmbr0
up route add 10.10.10.2/32 dev vmbr0
up route add 10.10.10.3/32 dev vmbr0

auto vmbr1
iface vmbr1 inet static
address 10.9.9.1
netmask 255.255.255.0
bridge_ports none
bridge_stp off
bridge_fd 0
post-up iptables -t nat -A POSTROUTING -j MASQUERADE
post-up iptables -t nat -A POSTROUTING -s ‚10.9.9.0/24‘ -o vmbr0 -j MASQUERADE
post-down iptables -t nat -F

# post-up echo 1 > /proc/sys/net/ipv4/ip_forward
# post-down iptables -t nat -D POSTROUTING -s ‚10.9.9.0/24‘ -o vmbr0 -j MASQUERADE
# post-up iptables -t nat -A POSTROUTING -o eth0 -s ‚10.9.9.0/24‘ -j SNAT –to 10.9.9.1
# post-up iptables -t raw -I PREROUTING -i fwbr+ -j CT –zone 1
# post-down iptables -t raw -D PREROUTING -i fwbr+ -j CT –zone 1
[/bash]

Erklärung: Hier siehst Du im Vergleich Routed NAT, welches Du bei jedem VPS, auch bei uns bei NWS, nutzen könntest.
Hinweis: Für Bare-Metal-Instanzen bei Hetzner würdest Du nur noch pointtopoint einkommentieren müssen.
Im Vergleich zu einer Bridged-Konfiguration siehst Du nun bei vmbr0 bridge-ports none auch magst Du Dich wundern wieso denn genau address 10.77.15.38/24 sowie gateway 10.77.15.254 je in ens3 und vmbr0 vorkommen. Das liegt daran dass wir nun im Vergleich zu Bridged keine zweite MAC einholen, sondern alles über iface ens3 inet static durchgeben –  und vmbr0 und vmr1 praktisch routen. Du könntest nun auch vmbr0 benutzen, aber vmbr1 ist in dem Beispiel bequemer, und setzt Dir ein komplettes ‚10.9.9.0/24‘-Netz mit entsprechenden NAT-Regeln das mit dem 10.9.9.1 Gateway kommunizieren kann.
Wichtig: Obwohl Du auch hier den ipv4-Forward aktivieren könntest, habe ich es in der /etc/sysctl.conf gemacht via net.ipv4.ip_forward=1  bzw. respektive net.ipv6.conf.all.forwarding=1.
Tipp: Ich persönlich benutze ab dieser Stelle (wo auch immer möglich) Nested-Docker in LXC-Containern um Server-Performanz zu sparen, und lege bequem Wireguard Clients in die jeweiligen Container, um diese von überall aus anzusprechen. Guides zu Wireguard findest Du von Markus und mir hier unserem NETWAYS Blog.
Übrigens: Meine Chefs von NETWAYS Professional Services bieten bald im Portfolio auch Consulting zu Proxmox an, welches von Icinga 2 überwacht werden kann.