Seite wählen

NETWAYS Blog

Testing Ansible Roles with Molecule

A while ago I was drafting an official Ansible Role for Icinga 2. From my previous experience with writing Puppet modules and helping shape Chef cookbooks I already knew approximately how the Ansible role should look like and what functionality should be included. At some point I came across the question how testing should be done during development?
From all the options available, two stuck out:
– KitchenCI with an Ansible provisioner
Molecule
I used TestKitchen in the past to test Chef cookbooks, so this was an advantage. However, after some research I decided to go with Molecule, a tool designed especially for Ansible roles and playbooks. It seems to me to be the better option to use a tool that explicitly aims to test Ansible stuff, rather then using TestKitchen which usually is used for Chef cookbooks but has an extension to support Ansible provisioning.
Molecule support multiple virtualization providers, including Vagrant, Docker, EC2, GCE, Azure, LXC, LXD, and OpenStack. Additionally, various test frameworks are supported to run syntax checks, linting, unit- and integration tests.

Getting started with Molecule

Molecule is written in Python and the only supported installation method is Pip. I won’t go through all requirements, since there’s a great installation documentation available. Besides the requirements, you basically just install molecule via Pip

pip install molecule

After molecule is successfully installed, the next step is to initialise a new Ansible role:

molecule init role -d docker -r ansible-myrole

This will not only create files and directories needed for testing, but the whole Ansible role tree, including all directories and files to get started with a new role. I choose to use Docker as a virtualisation driver. With the init command you can also set the verifier to be used for integration tests. The default is testinfra and I stick with that. Other options are goss and inspec.
Molecule uses Ansible to provision the containers for testing. It creates automatically playbooks to prepare, create and delete those containers. One special playbook is created to actually run your role. The main configuration file, molecule.yml includes some general options, such as what linter to use and on which platform to test. By default cents:7 is the only platform used to test the role. Platforms can be added to run the tests on multiple operating systems and versions.
I mentioned before that I use testinfra to write the integration tests. With the init command Molecule creates a default scenario, which we can use for the first steps. For example, checking if a package is installed and a the service is running the code would look like this:

import os
import testinfra.utils.ansible_runner
testinfra_hosts = testinfra.utils.ansible_runner.AnsibleRunner(
    os.environ['MOLECULE_INVENTORY_FILE']).get_hosts('all')
def test_icinga2_is_installed(host):
    i2_package = host.package("icinga2")
    assert i2_package.is_installed
def test_icinga2_running_and_enabled(host):
    i2_service = host.service("icinga2")
    assert i2_service.is_running
    assert i2_service.is_enabled

Running tests

There are multiple ways to run your tests, but there’s one command that does everything automatically. It runs listing tests, provisions containers, runs your playbook, runs integration tests, shows failures and destroys the containers at the end.

molecule test

With other commands you can do all of these steps one by one. Of course there’s much more possible with molecule, such as creating different scenarios and using multiple instances to do more complex testing. The Molecule documentation is well written and has some examples on what you can do more.

Blerim Sheqa
Blerim Sheqa
COO

Blerim ist seit 2013 bei NETWAYS und seitdem schon viel in der Firma rum gekommen. Neben dem Support und diversen internen Projekten hat er auch im Team Infrastruktur tatkräftig mitgewirkt. Hin und wieder lässt er sich auch den ein oder anderen Consulting Termin nicht entgehen. Inzwischen ist Blerim als COO für Icinga tätig und kümmert sich dort um die organisatorische Leitung.

The Impact of Voice and Tone in Writing


Did you realize, when you read something your brain maps the words to a particular voice in your head? Your inner voice reads out loud the wordsyou’re reading. Actually, not everyone has this, but most people do. Ruvanee Vilhauer from the New York University did some research on this and found out that the vast majority (82%) said that they do hear an inner voice when reading to themselves.
The interesting thing about this is, that the inner voice varies depending on the written words, grammar and even the punctuation. Certain texts manage to let our inner voice sound enthusiastic, others make it sound sad, happy, thoughtful and so on.
Marketing professionals for content marketing and digital communication take advantage of this, for example when building brands. Depending on the target audience, advertising texts have their own sound and feel. Our inner voice has a huge impact on how we feel about something. It is much more likely that we recommend a product or a brand if our inner voice sounds excited while reading a text about it.

The Voice and Tone in Writing

The voice is the distinct personality of a text, be it in a magazines article, blog post, website or just a short tweet. A writer’s voice is something uniquely their own. It is build based on the words the writer uses, the grammar, punctuation, mechanics and overall style he uses. Readers begin to construct a person based on the voice and tone of a text. Beside the headline, the first sentence is the most important part of a text. It decides whether the reader continues reading and with how much attention he will continue. The voice gives personality to the writing and helps grab the readers attention and build a relationship.
The tone is more like a subset of the voice. It adds a mood to the personality and therefore a mood of our inner voice. The writing tone helps us specify if your inner voice sounds excited, amused or thoughtful. Further, if correctly pulled through, the writing tone emphasises the whole image of a product. At some point, it’s more a matter of how something is said than what is said.
Of course, IT companies benefit from all of this like any other company. One of the main aspects if a brand or a product is successful is it’s textual presentation. Usually, IT companies (especially startups) try to make their users feel enthusiastic about their product or upcoming event. When reading their texts and tweets, often it feels like something really big and great going to happen. And you definitely don’t want to miss anything big and great. You could loose track and in the IT business it can happen pretty fast to miss something. As we all know, technology changes very fast.
The voice and tone runs through the entire marketing concept. It helps us differentiate the interesting from the boring stuff. For marketers it is an important instrument to build a friendly and trustworthy image for the product. The way we read our everyday texts, especially tweets and blogs, has a huge impact on how we see IT companies and their products, independent from their technical achievements. If the company misses to delight you about their brand and product, they will have a much harder time to actually convince you to use it. If the tweets and blogs have a more conversational, friendly and trustworthy tone, it’s more likely that you will get motivated to actually give it a try.
There are so much more details about this topic which I never could fit into a blogpost. The key takeaway of this post is that it’s definitely worth thinking about the voice of tone of a text and the inner voice of the reader when writing for a certain product, even if you are not a professional marketer. A great article to get started with this topic is listed on the website of Nielsen Norman Group.

Blerim Sheqa
Blerim Sheqa
COO

Blerim ist seit 2013 bei NETWAYS und seitdem schon viel in der Firma rum gekommen. Neben dem Support und diversen internen Projekten hat er auch im Team Infrastruktur tatkräftig mitgewirkt. Hin und wieder lässt er sich auch den ein oder anderen Consulting Termin nicht entgehen. Inzwischen ist Blerim als COO für Icinga tätig und kümmert sich dort um die organisatorische Leitung.

IcingaCamp Berlin: Das Programm steht


Das diesjährige IcingaCamp in Berlin rückt näher und näher, und das Programm sieht fantastisch aus! Das IcingaCamp ist eine Veranstaltung bei der es den ganzen Tag um den Wahnsinn namens Monitoring geht. Anwender aus der Community und gewerblichen Unternehmen kommen zusammen mit Entwicklern aus dem Icinga Team. Neben den Vorträgen über best practices und dem aktuellen Stand von Icinga, wird auch ein Ausblick auf die Zukunft von Icinga gegeben. Natürlich geht es bei dem Event aber nicht allein um Vorträge, es ist auch eine Platform für den Austausch zwischen Entwicklern und Usern und Anwendern untereinander.

Das Programm

09:30 AM Bernd Erk State of Icinga
10:00 AM Blerim Sheqa Graphs tell Stories
11:00 AM Michael Friedrich Dev and Ops stories: Integrations++
11:45 AM Nicolai Buchwitz Automated Monitoring of Proxmox VE with Icinga Director
1:30 PM Michael Medin Getting Windows to play along
2:15 PM Thomas Gelf Automated Monitoring in heterogeneous environments
3:30 PM Sebastian Saemann Icinga as a Service
4:00 PM Eric Lippmann What’s evolving in Icinga

Teilnahme

Es ist noch nicht zu spät sich für das Camp zu registrieren. Alle Early Bird Tickets sind zwar schon vergeben, normale Tickets sind allerdings noch verfügbar. Die Anzahl der Tickets ist leider limitiert, aktuell sind nur noch 12 Plätze frei. Registrieren kann man sich über die Webseite von Icinga.
 

Blerim Sheqa
Blerim Sheqa
COO

Blerim ist seit 2013 bei NETWAYS und seitdem schon viel in der Firma rum gekommen. Neben dem Support und diversen internen Projekten hat er auch im Team Infrastruktur tatkräftig mitgewirkt. Hin und wieder lässt er sich auch den ein oder anderen Consulting Termin nicht entgehen. Inzwischen ist Blerim als COO für Icinga tätig und kümmert sich dort um die organisatorische Leitung.

Benchmarking Graphite

Before using Graphite in production, you should be aware of how much load it can handle. There is nothing worse than finding out your carefully planned and build setup is not good enough. If you are already using Graphite, you might want to know the facts of your current setup. Knowing the limits of a setup helps you to react on future requirements. Benchmarking is essential if you really want to know how many metrics you can send and how many requests you can make. To find this out, there are some tools out there that help you to run benchmarks.

Requirements

The most important thing you need when starting to benchmark Graphite is time. A typical Graphite stack has 3 – 4 different components. You need plenty of time to properly find out how much load each of them can handle and even more to decide which settings you may want to tweak.

Haggar

Haggar is a tool to simulate plenty of agents that send generated metrics to the receiving endpoint of a Graphite stack (carbon-cache, carbon-relay, go-carbon, etc…). The amount of agents and metrics is configurable, as well as the intervals. Even though Haggar does not consume much resources, you should start it on a separate machine.
Haggar is written in go and installed with the go get command. Ensure that Go (>= v1.8) is installed and working before installing Haggar.
Installing Haggar

go get github.com/gorsuch/haggar

You’ll find the binary in your GOPATH that you have set during the installation of Go previously.
Running Haggar:

$GOPATH/bin/haggar -agents=100 -carbon=graphite-server.example.com:2003 -flush-interval=10s -metrics=1000

Each agent will send 1000 metrics every 10 seconds to graphite-server.example.com on port 2003. The metrics are prefixed with haggar. by default. The more agents and metrics you send, the more write operations your Graphite server will perform.
Example output of Haggar:

root@graphite-server:/opt/graphite# /root/go/bin/haggar -agents=100 -carbon=graphite-server.example.com:2003 -flush-interval=10s -metrics=1000
2017/09/21 09:33:30 master: pid 16253
2017/09/21 09:33:30 agent 0: launched
2017/09/21 09:33:42 agent 1: launched
2017/09/21 09:33:46 agent 2: launched
2017/09/21 09:34:00 agent 0: flushed 1000 metrics
2017/09/21 09:34:02 agent 1: flushed 1000 metrics
2017/09/21 09:34:06 agent 2: flushed 1000 metrics

Testing the write performance is a good starting point, but it’s not the whole truth. In a production environment data is not only written but also read. For example by users staring at dashboards all day long. So reading the data is as much important as writing it because it also produces load on a server. This is where JMeter comes into play.

JMeter

Apache JMeter usually is used to test the performance of web applications. It has many options to simulate requests against a web server. JMeter can also be used to simulate requests against Graphite-Web. You should do this simultaneously while Haggar is sending data, so you have the “complete” simulation.
The easiest way to configure JMeter is the graphical interface. Running test plans is recommended on the command line, though. Here’s an example how I set up JMeter to run requests against Graphite-Web:

  • Add a Thread Group to the Test Plan
    • Set the Number of Threads (eg. 5)
    • Set the loop count to Forever
  • Add a Random Variable to the Thread Group
    • Name the variable metric
    • Set the minimum to 1
    • Set the maximum to 1000
    • Set `Per Thread` to true
  • Add another Random Variable to the Thread Group
    • Name the variable agent
    • Set the minimum to 1
    • Set the maximum to 100
    • Set Per Thread to true

Haggar uses numbers to name it’s metrics. With these variables we can create dynamic requests.

  • Add a HTTP Request Defaults to the Thread Group
    • Set the server name or IP where your Graphite-Web is running (eg. graphite-server.example.com)
    • Add the path /render to access the rendering API of Graphite-Web
    • Add some parameters to the URL, examples:
      • width: 586
      • height: 308
      • from: -30min
      • format: png
      • target: haggar.agent.${agent}.metrics.${metric}

The most important part about the request defaults is the target parameter.

  • Add a HTTP Request to the Thread Group
    • Set the request method to GET
    • Set the request path to /render
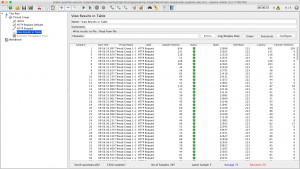
  • Add a View Results in Table to the Thread Group

The results table shows details of each request. On the bottom there is an overview of the count of all samples, the average time and deviation. Optionally you can also add a Constant Throughput Timer to the Thread Group to limit the requests per minute.
If everything is working fine, you can now start the test plan and it should fire lots of requests against your Graphite-Web. For verification, you should also look into the access logs, just to make sure.
At this point your Graphite server is being hit by Haggar and JMeter at the same time. Change the settings to find out at which point your server goes down.

Interpretation

Obviously, killing your Graphite server is not the point of running benchmarks. What you actually want to know is, how each component behaves with certain amounts of load. The good thing is, every Graphite component writes metrics about itself. This way you get insights about how many queries are running, how the cache is behaving and many more.
I usually create separate dashboards to get the information. For general information, I use collectd to monitor the following data:

  • Load, CPU, Processes, I/O Bytes, Disk Time, I/O Operations, Pending I/O Operations, Memory

The other dashboards depend on the components I am using. For carbon-cache the following metrics are very interesting:

  • Metrics Received, Cache Queues, Cache Size, Update Operations, Points per Update, Average Update Time, Queries, Creates, Dropped Creates, CPU Usage, Memory Usage

For carbon-relay you need to monitor at least the following graphs:

  • Metrics Received, Metrics Send, Max Queue Length, Attempted Relays, CPU Usage, Memory Usage

All other Graphite alternatives like go-carbon or carbon-c-relay also write metrics about themselves. If you are using them instead of the default Graphite stack, you can create dashboards for them as well.


Observing the behaviour during a benchmark is the most crucial part of it. It is important to let the benchmark do its thing for a while before starting to draw conclusions. Most of the tests will peak at the start and then calm after a while. That’s why you need a lot of time when benchmarking Graphite, every test you make will take its own time.

Performance Tweaks

Most setups can be tuned to handle more metrics than usual. This performance gain usually comes with a loss of data integrity. To increase the number of handled metrics per minute the amount of I/Ops must be reduced.
This can be done by forcing the writer (eg. carbon-cache) to keep more metrics in the memory and write many data points per whisper update operation. With the default carbon-cache this can be achieved by setting MAX_UPDATES_PER_SECOND to a lower value than the possible I/Ops of the server. Another approach is to let the kernel handle caching and allow it to combine write operations. The following settings define the behaviour of the kernel regarding dirty memory ratio.

  • vm.dirty_ratio (eg. 80)
  • vm.dirty_background_ratio (eg. 50)
  • vm.diry_expire_centisecs (eg. 60000)

Increasing the default values will lead to more data points in the memory and multiple data points per write operation.
The downside of these techniques is that data will be lost on hardware failure. Also, stopping or restarting the daemon(s) will take much longer, since all the data needs to be flushed to disk first.

Blerim Sheqa
Blerim Sheqa
COO

Blerim ist seit 2013 bei NETWAYS und seitdem schon viel in der Firma rum gekommen. Neben dem Support und diversen internen Projekten hat er auch im Team Infrastruktur tatkräftig mitgewirkt. Hin und wieder lässt er sich auch den ein oder anderen Consulting Termin nicht entgehen. Inzwischen ist Blerim als COO für Icinga tätig und kümmert sich dort um die organisatorische Leitung.

Ruby Applikationen testen mit RSpec und WebMock

Das Testen von Software begleitet mich von Projekt zu Projekt. Bei bisherigen Entwicklungen habe ich immer wieder auf RSpec zurück gegriffen, ein tool zum testen von Ruby Applikationen. Es zeichnet sich durch eine relativ einfache Handhabung aus und eine Ausdrucksweise die an die menschliche Sprache angelehnt ist. Auch wenn nicht jeder mögliche einzutretende Fall getestet werden kann, tests geben Entwicklern Sicherheit wenn Änderungen am Code vorgenommen werden.

WebMock

WebMock ist eine Library die es einem ermöglich HTTP requests auszudrücken und Erwartungen an diese zu setzen. In Verbindung mit RSpec lässt sich WebMock verwenden um eine Ruby Anwendung zu testen die HTTP Requests ausführt, beispielsweise an eine API. Oft sind diese Requests nicht starr sondern werden dynamisch anhand von Parametern zusammen gesetzt. WebMock/RSpec hilft dabei unterschiedliche Fälle zu simulieren, Erwartungen zu definieren und diese mit zu prüfen.
WebMock ist als Gem verfügbar, die Installation ist daher relativ einfach:

user@localhost ~ $ gem install webmock

Als Beispiel verwende ich eine sehr simple Ruby Klasse. Deren einzige Methode ‘request’ sendet einen GET request an die URL ‘https://wtfismyip.com’. Abhängig vom Parameter ‘option’ wird die IP entweder in Textform oder als JSON abgefragt:

require 'net/http'
require 'uri'
class ApiCaller
  def self.request(option)
    uri = URI.parse("https://wtfismyip.com/#{option}")
    http = Net::HTTP.new(uri.host, uri.port)
    http.use_ssl = true
    request = Net::HTTP::Get.new(uri.request_uri)
    http.request(request)
  end
end

Mein Test beinhaltet den Aufruf der ‘request’ Methode. Der HTTP request wird simuliert und die Erwartung das ein Request an eine bestimmte URL stattfinden soll wird auch definiert.

require 'api_caller'
require 'webmock/rspec'
describe ApiCaller do
  describe '.request' do
    context 'given json parameter' do
      it 'requests json url' do
        stub_request(:get, 'https://wtfismyip.com/json')
        expect(ApiCaller.request('json')).
          to have_requested(:get, 'https://wtfismyip.com/json').once
      end
    end
    context 'given text parameter' do
      it 'requests text url' do
        stub_request(:get, 'https://wtfismyip.com/text')
        expect(ApiCaller.request('text')).
          to have_requested(:get, 'https://wtfismyip.com/text').once
      end
    end
  end
end

Beim testen sieht das nun folgendermaßen aus:

user@localhost ~ $ rspec --format documentation
ApiCaller
  .request
    given json parameter
      requests json url
    given text parameter
      requests text url
Finished in 0.00557 seconds (files took 0.37426 seconds to load)
2 examples, 0 failures
Blerim Sheqa
Blerim Sheqa
COO

Blerim ist seit 2013 bei NETWAYS und seitdem schon viel in der Firma rum gekommen. Neben dem Support und diversen internen Projekten hat er auch im Team Infrastruktur tatkräftig mitgewirkt. Hin und wieder lässt er sich auch den ein oder anderen Consulting Termin nicht entgehen. Inzwischen ist Blerim als COO für Icinga tätig und kümmert sich dort um die organisatorische Leitung.