
About a month ago OSMC took place and I was happy to attend an offline conference again. One of the things I enjoy most at conferences is networking and this is why I know Julien Pivotto already for years. He focused his work a while ago on Prometheus and is a regular speaker at OSMC, typically not only giving a talk but also a workshop. And now he is also a maintainer of Prometheus. So who could be a better speaker to give an update talk summarizing the news from the last year?
Julien started with a short introduction to Prometheus which I want to repeat here as some readers will also likely not be familiar with the tool. Prometheus is an Open Source monitoring solution based on metrics. It provides a Service Discovery to find metric endpoints to pull data from. PromQL – the Prometheus Query Language – is then used to query and visualize data in the frontend. The project while sometimes still called a new competitor in the field of monitoring solutions has already some history and is a graduated CNCF project since 2018, so we do talk about a project that already left its footprints in the monitoring ecosystem.
Helpful when Exploring Metrics
The first topic Julien covered was the new react UI providing a query editor for PromQL including autocompletion and formatting. The metrics explorer now also supports using the local timezone instead of UTC which can be quite helpful when debugging as it removes the need to calculate this. Also very helpful is the option to filter targets and service discovery to reduce the amount of shown data. The option to show and explain CLI flags helps to tailor your installation to your needs. And as every software it now has to provide also a dark mode!
The next feature he introduced was the agent mode allowing to have an instance which only sends metrics and does not provide all the overhead like the UI if not needed. I would say the remote write receiver is a corresponding feature as it allows for federation of writes by rules as another system tailored to your needs.
The list of service discoveries increased by many new cloud and configuration management solutions, but the one to highlight is the Generic HTTP which allows for the most common and easy to implement one, a REST API with JSON body.
Relabeling capabilities are quite nice and simple ones like uppercase or lowercase are a common use case. But setting some specific labels also allows to do some scraping configuration like changing the interval.
Additions to PromQL
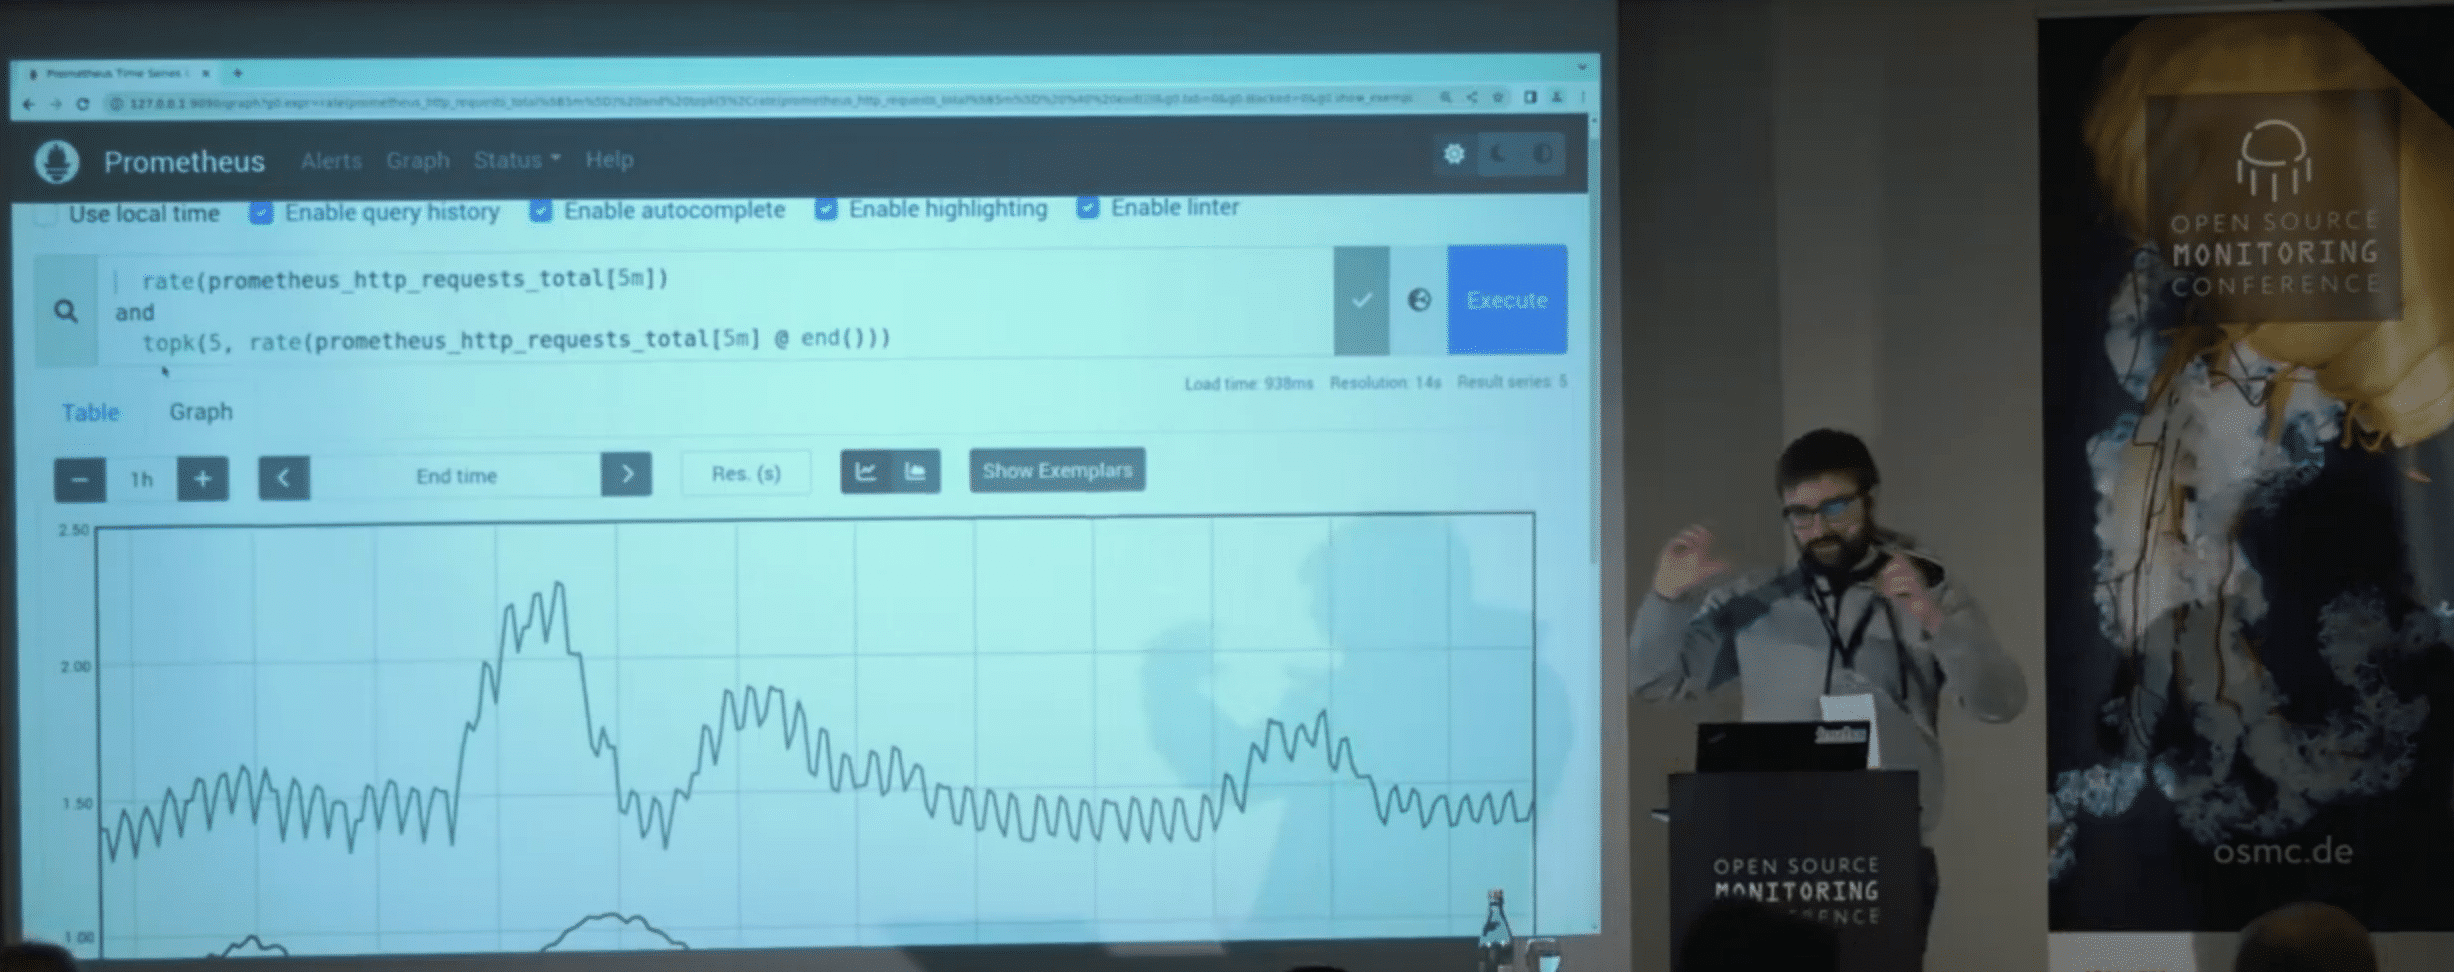
The additions to PromQL were a bigger part of Julien’s demo. One of the many new functions to mention is last_over_time which fills the graph with the last value coming in handy if a target does not provide metrics regularly. The option to have a negative offset is also great to mitigate errors in this case if a system was not in sync and did send with an offset of some minutes. But the most important new function is the new modifiers allowing you to get for example the top 5 at a specific time and then get the values for this specific metrics. This allows to visualize how the top 5 developed over time instead of simply showing the top 5 without how they have changed over time. By doing so you get much nicer and informative graphs.
Out of time metrics support allows to fill old metrics in the configured interval, so you can allow this temporarily to fill in gaps if needed by adding a timestamp to the metric.
The new LTS version allows the users to have 6+ month stable APIs while the developers can improve and release still every 6 weeks. Julien showed also how prominent they show the LTS version on the download page and documentation. This is something other projects could learn from. Talking about versioning they also synchronized the end user and go module’s minor version to show the compatibility.
Only the Required Features Set
The developers also introduced a plugin system which allows to build Prometheus with only the required feature set like only the needed service discoveries to reduce the size of the binary.
Also the Alertmanager got some new features. There is the option to mute alerts based on time for receivers allowing for example to honor on-duty and holidays. Negative matchers allow for a simpler ruleset and the new receivers provide more ways of notification.
Exporters in general got systemd socket activation and can now bind to multiple addresses. The node exporter providing information about a system got more collectors and the ones for MySQL and PostgreSQL can now handle multiple targets allowing to have only one for multiple databases reducing the amount of installations.
The Prometheus ecosystem also got a new Rust client , 30+ repositories in the prometheus-community organization, a certification program to prove your Prometheus skills and a conformance program for vendors to show compatibility of their software.
Introducing PromLens
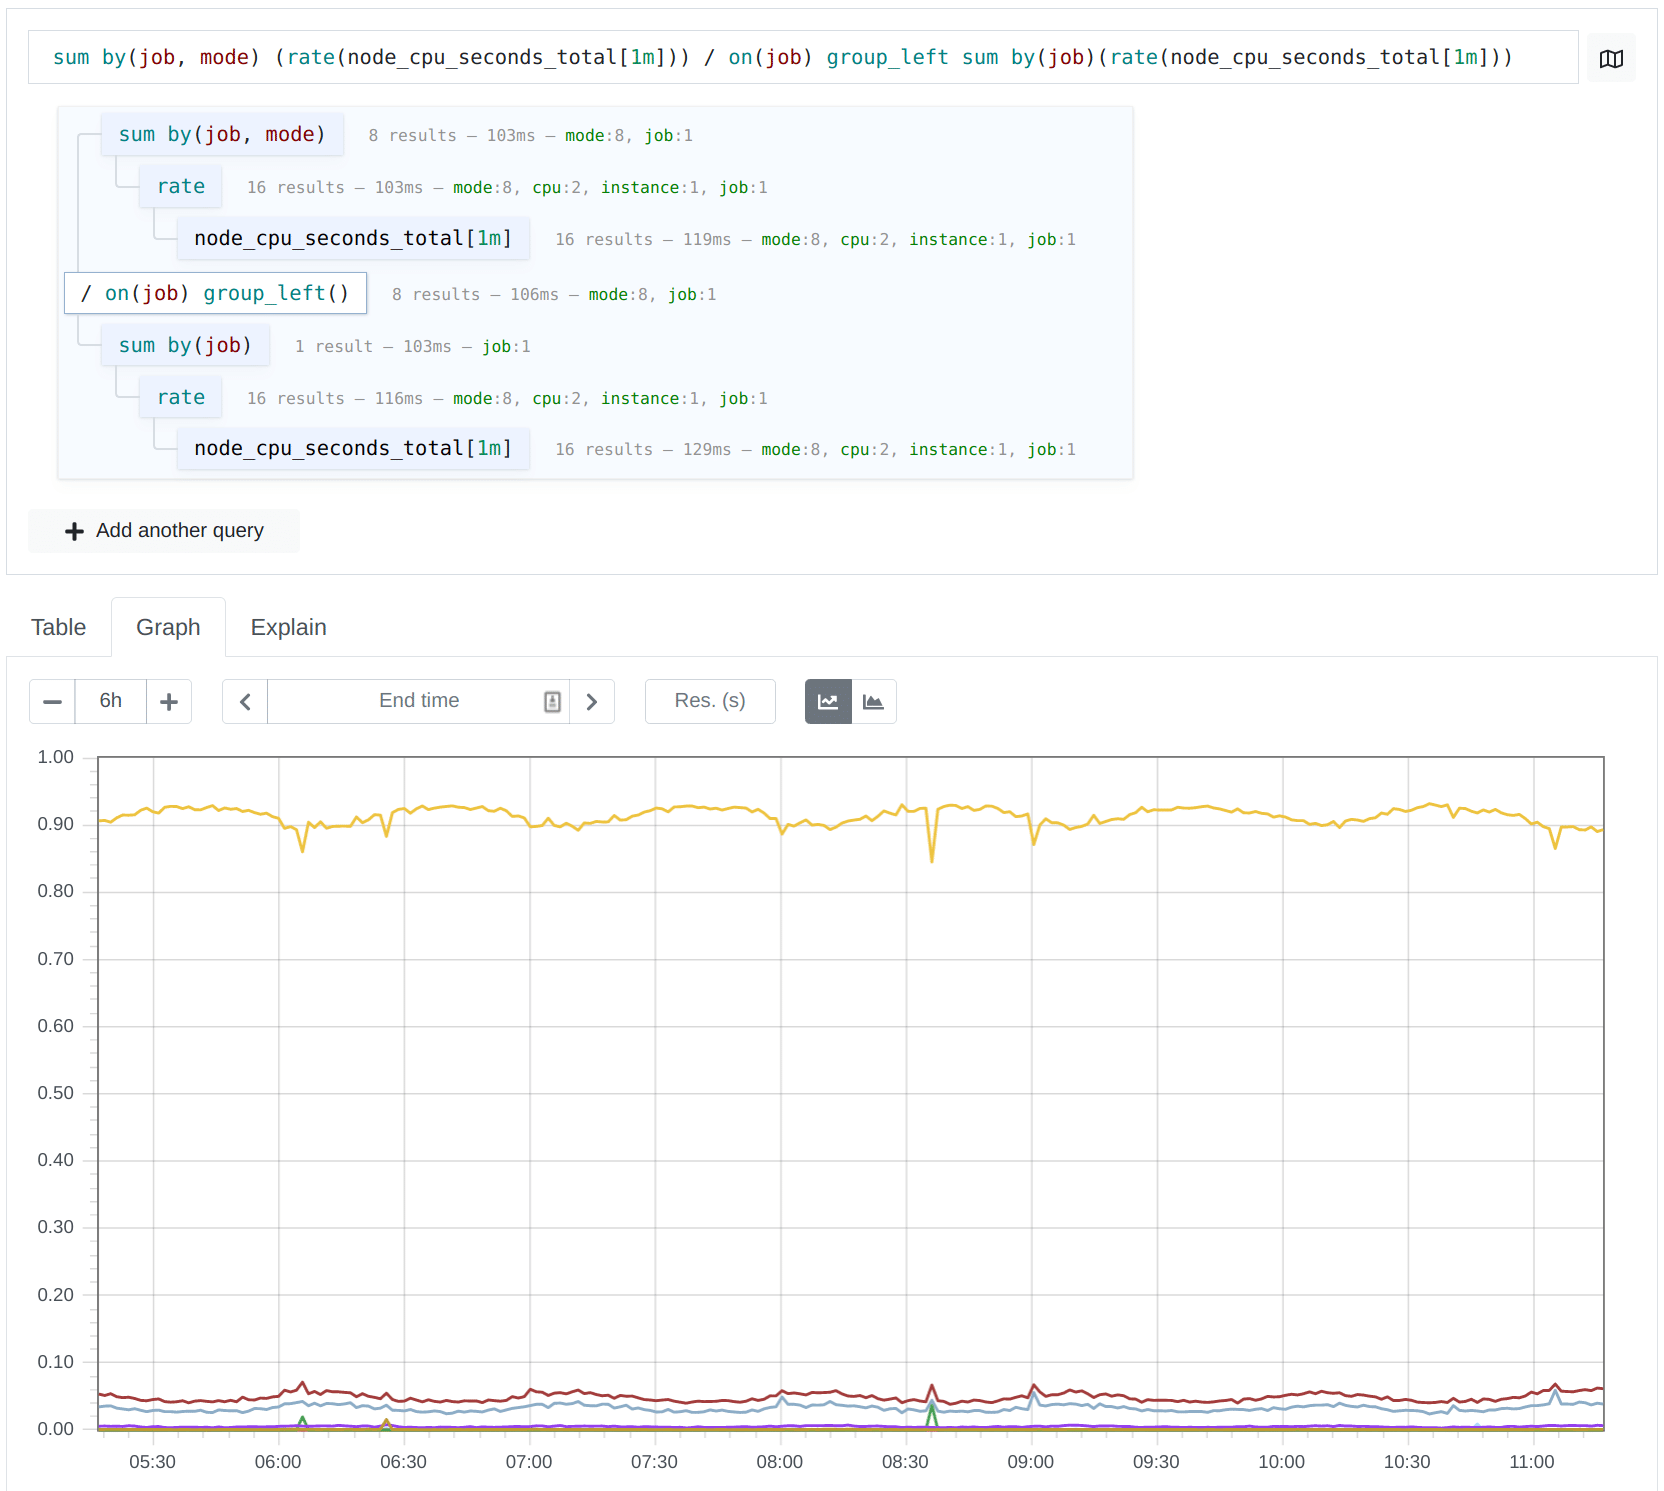
And last but not least Julien introduced PromLens, a new separate Querybuilder with a great Explain functionality detailing how your query functioned and how many results are found. While planned as a separate tool a subset of the features should also be integrated in the normal UI to improve the user experience.
As Julien said, it was a great amount of topics to cover and I tried to summarize further. Please watch the recording of his talk in our OSMC Archives for more details. You will get some practical examples when he demos most of the topics mentioned above as he did a great job. If you are new to Prometheus we also have you covered with our NETWAYS training course „Prometheus Fundamentals“. Check it out!
We hope to see you around at OSMC 2023! Stay in touch and subscribe to our Newsletter!


0 Kommentare