
Welcome to our recap series of the Open Source Monitoring Conference 2022 (OSMC 2022) in Nuremberg. Last year the workshop and hackathon concluded the OSMC. This year three workshops will kick-off our long awaited conference. While the conference will be consecutive talks about amazing new innovations and features the workshops are the calm before the storm.
In a calm but constructive and educational environment, our experienced trainers provide theoretical insights and practical exercises in their field. Today I will guide you through the following workshops: Kubernetes, Icinga Director and Director Branches and last but not least Prometheus.
A little disclaimer beforehand: this blog post is no detailed overview of the workshops. If you want to learn more about one of the topics I highly encourage you to visit the respective training, it’s worth it. With this said: let’s get going!
First Stop: Container Orchestration with Kubernetes
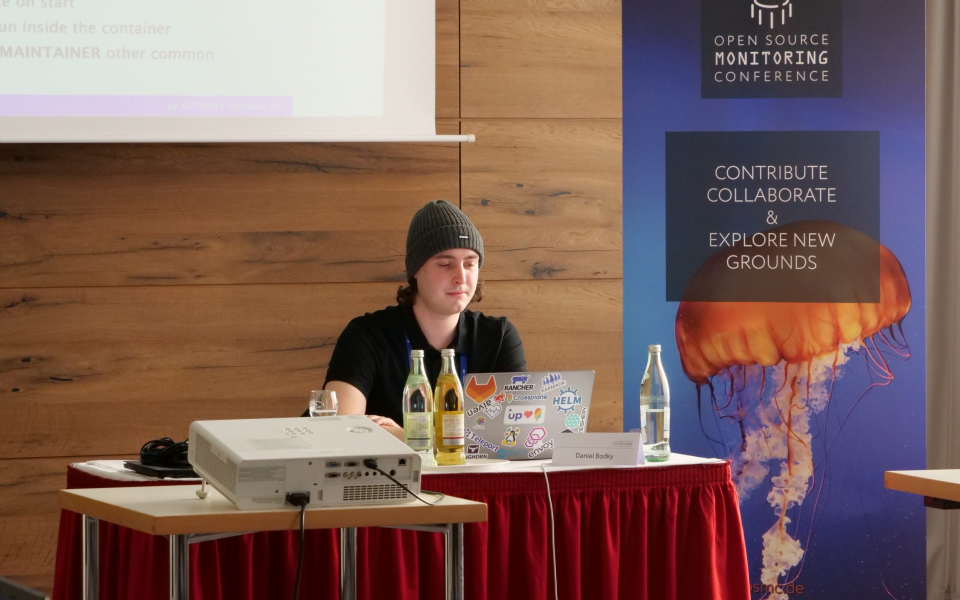
Our colleague in NETWAYS Professional Services Consulting Daniel Bodky is holding his first workshop at OSMC, after he got a first impression of the conference as a visitor last year. Already at the beginning he sets the stage for his Kubernetes workshop. The next few hours are planned to be a dialog with impressions from the paritcipants’ work reality.
Since Kubernetes is a ’new‘ technology for container orchestration, the group of participants is mixed. Participants with experience in the area of Docker and Kubernetes as well as beginners are present. So the starting point of the workshop is Docker. Because before you can deal with Kubernetes, it is important to learn and know about Docker containers and how they work. They are the very basis for the successful use of Kubernetes.
To build this base Daniel guides his attendees through the theoretical and practical handling of Docker images. Now that all the groundwork is done the attendees take their first steps in Kubernetes … with a theoretical overview of what Kubernetes is and isn’t. After all this theory it is time to put the gained knowledge into action. The following practical topics like Deployment, Service & Ingress or Volumes in Kubernetes offer the possibility to get hands-on experience.
Through the structure of theory (for all levels of knowledge) and practical exercises to apply the new knowledge all attendees can easily participate and achieve success. With this impressions of the OSMC Kubernetes workshop let’s go to our next stop: Prometheus.
Second Stop: Metric Monitoring with Prometheus
The second ‘new’ tool which got a lot of buzz over the last few years is Prometheus. Why is it so popular? Apart from the big companies using it (e.g. SoundCloud and Docker) it is using a different monitoring approach than well known tools like our Icinga 2 or Nagios.
The Prometheus-team is putting metrics and data in the center of their monitoring approach. With his vast ecosystem of different components it can be complex if getting into it without the proper introduction. The trainer of this workshop Julien Pivotto of O11y knows this from experience and is giving his attendees the needed guidance through the Prometheus world and how Prometheus and its different components work together.
As it is a workshops designed for beginners in the world of Prometheus after the introduction the first hands-on lab is the download and installation of the Prometheus ecosystem. After the first hands-on experience is done and the first fear of contact is lifted it is time to get accustomed with some more essentials. Like with every new tool it is important to understand two things: wording and how the system works. Like which functions and aggregators are commonly used in Prometheus or what tools help you use and understand the metrics of Prometheus better. Julien is showing a lot of insights in common mistakes and also the complexity of Prometheus.
Why complexity? Because Prometheus is collecting ALL THE METRICS. If there are no conditions set a lot of data is displayed. So it is important to know what you want to check and customize Prometheus to meet your goals. There are so much more topics I could write about like Grafana as go-to Dashboard or how Prometheus handles alerts if certain conditions are met. But it is time for our last workshop: Icinga Director and Director Branches.
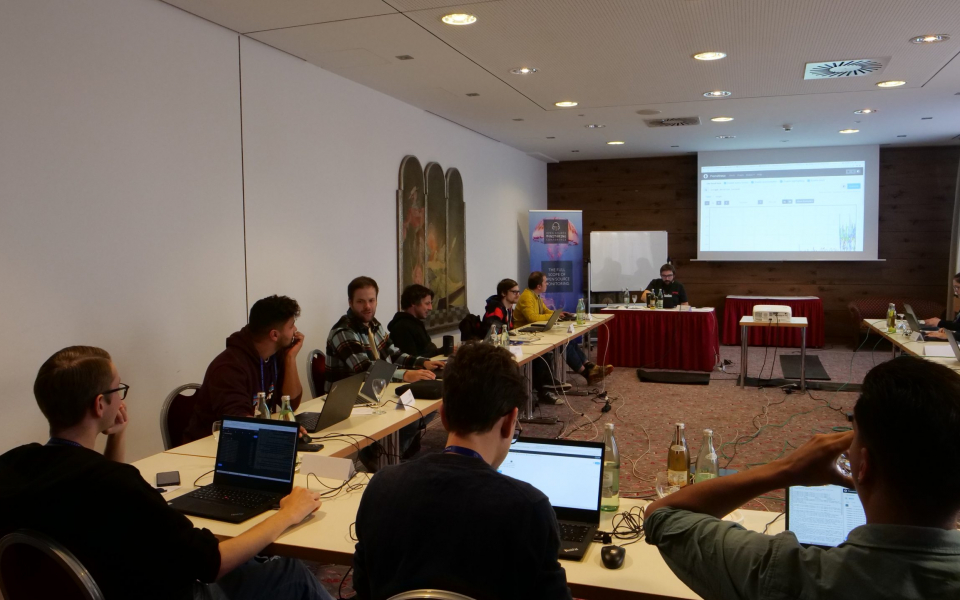
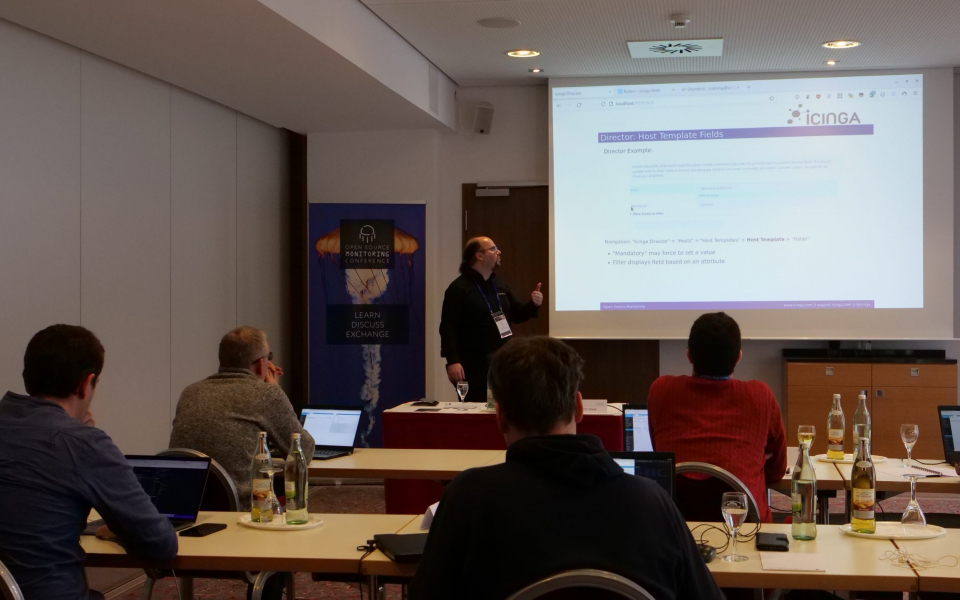
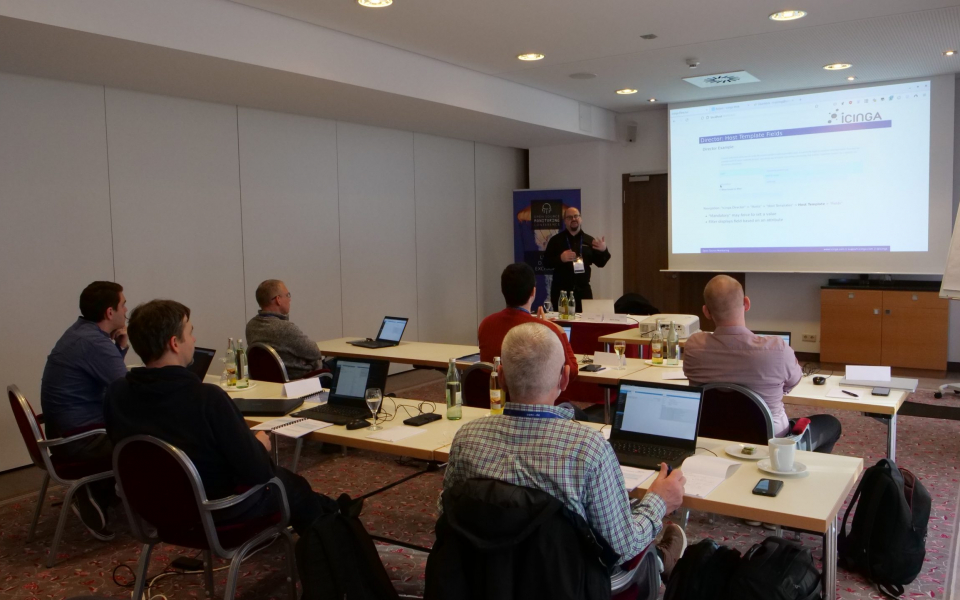
Third Stop: Configuration with the Icinga Director and Director Branches
While the Prometheus workshop is about getting started with the monitoring tool, the Icinga Director workshop offers hands-on exercises and related knowledge about the Icinga 2 web configuration tool. In addition to the introduction to the Icinga Director, practical questions will be addressed from the beginning, since many of the participants already deal with Icinga 2 monitoring in their daily practice.
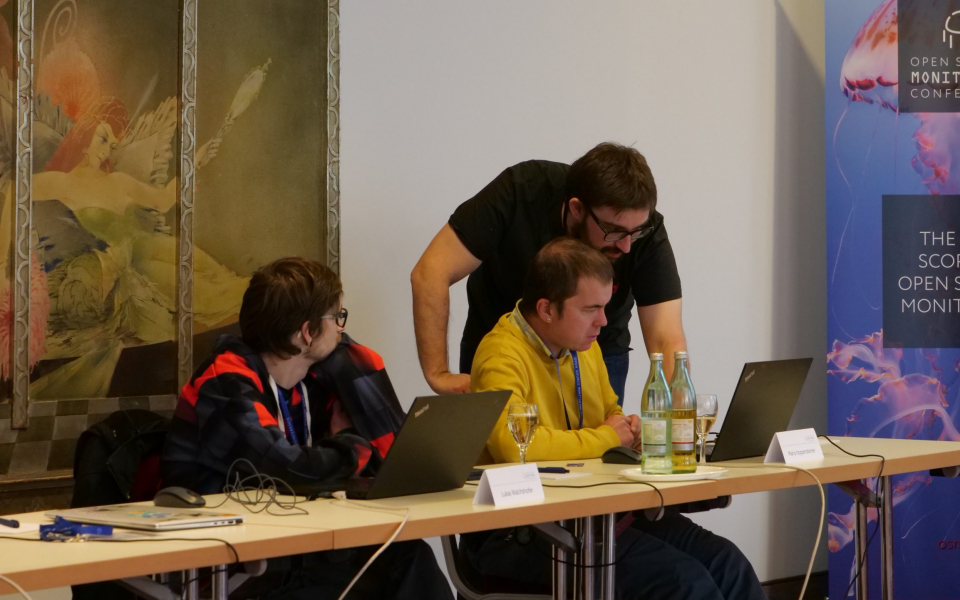
For many, the workshop serves as a support for explicit practical problems, where the experienced Principal Consultant of NETWAYS Professional Services Dirk Götz can offer best practices from his years of consulting experience. In order to make the best possible use of the Director’s many setting options, the workshop focuses on relevant setting options and how these can be and how they can best be implemented.
The many configuration options also show the strengths of Icinga 2 as a monitoring tool and the monitoring tool and the Director as a configuration tool: customizability.
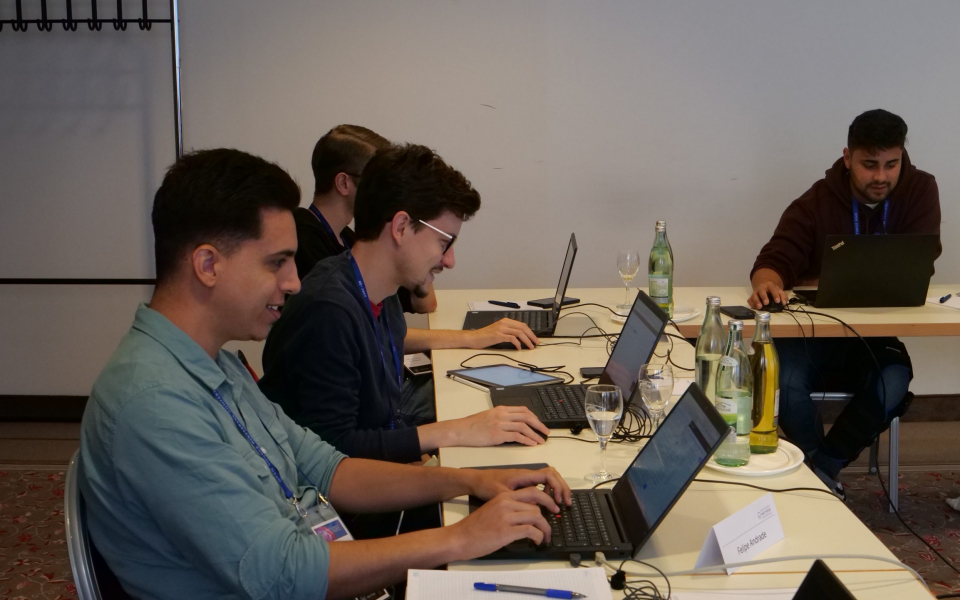
No matter what logic is required, what specifications there are and what objectives the monitoring has everything can be set via the Icinga Director. Like every OSMC workshop this one also offers a balanced mix of theoretical input and hands-on labs to give the attendees the chance to test out their new knowledge.
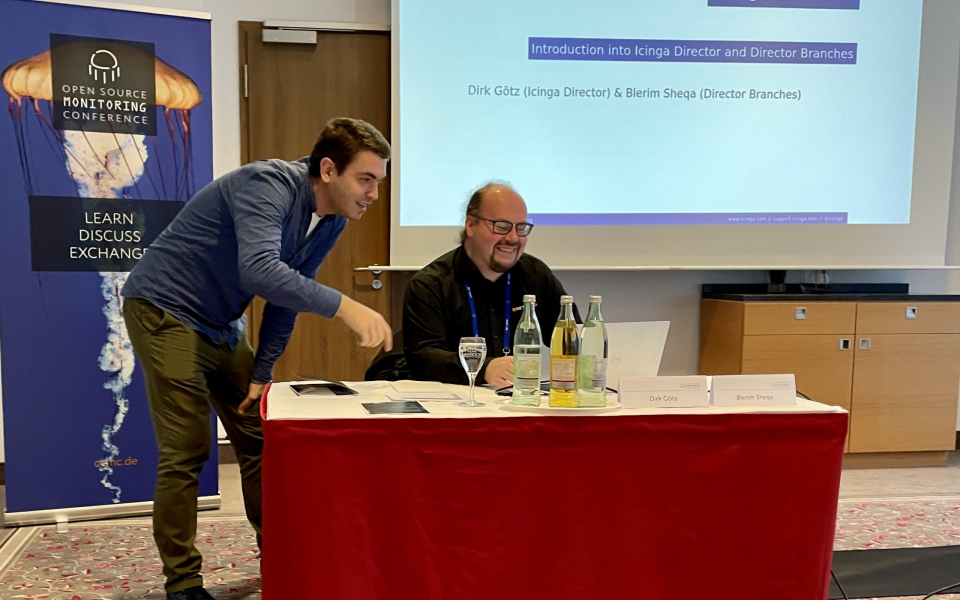
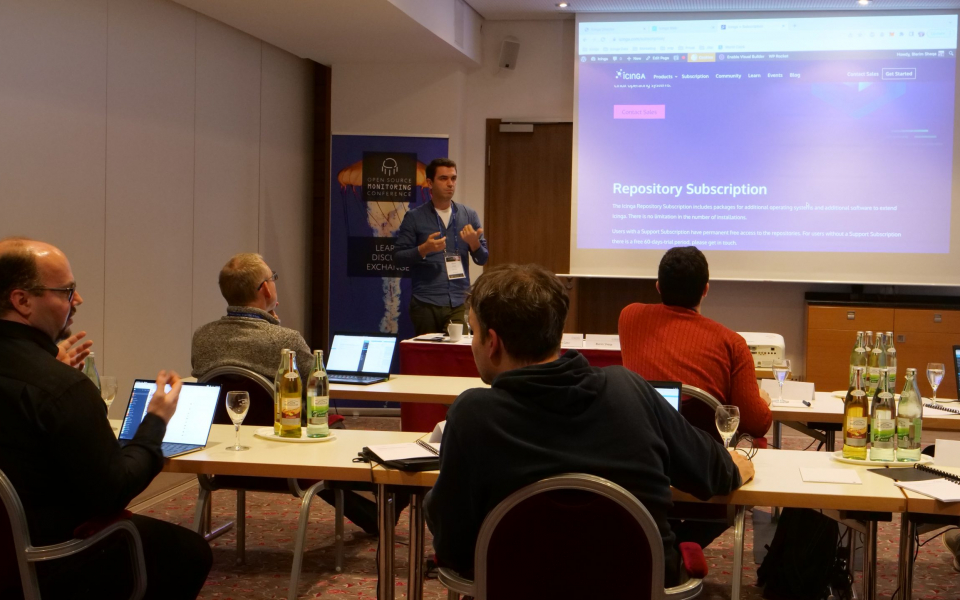
After the introduction into the Icinga Director, Blerim Sheqa, Chief Product Office of the Icinga GmbH is introducing a new feature: Director Branches. This new tool is an extension for the Icinga Director and aims to provide a safe virtual working environment for development and administration teams.
The workflow of Director branches is based on git. You can create different configuration branches and in the end merge them into your productive environment. With this virtual safe space you and your teams can try out different adjustments and settings without the risk of crashing you complete monitoring setup.
Another benefit is the possibility for different teams and users to work at their own parts at the same time without getting into each others way. Another nice feature is the comment section every merge must have. Every time you check the activity log your administrators can check what changes have been deployed. With this look at a new Icinga Director feature our little tour through todays workshops comes to a close.
Last but not Least: A Little Peak Behind the Scenes
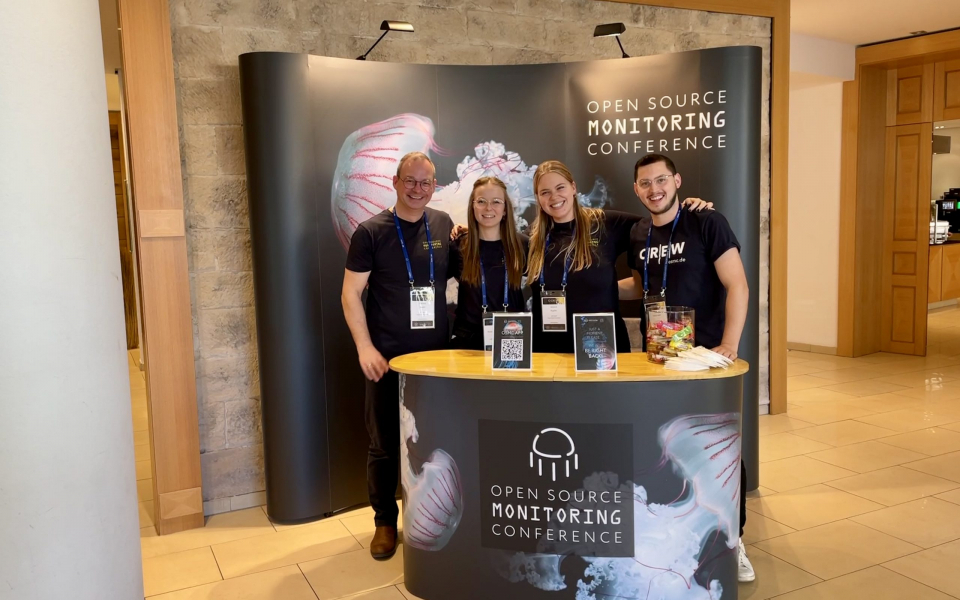
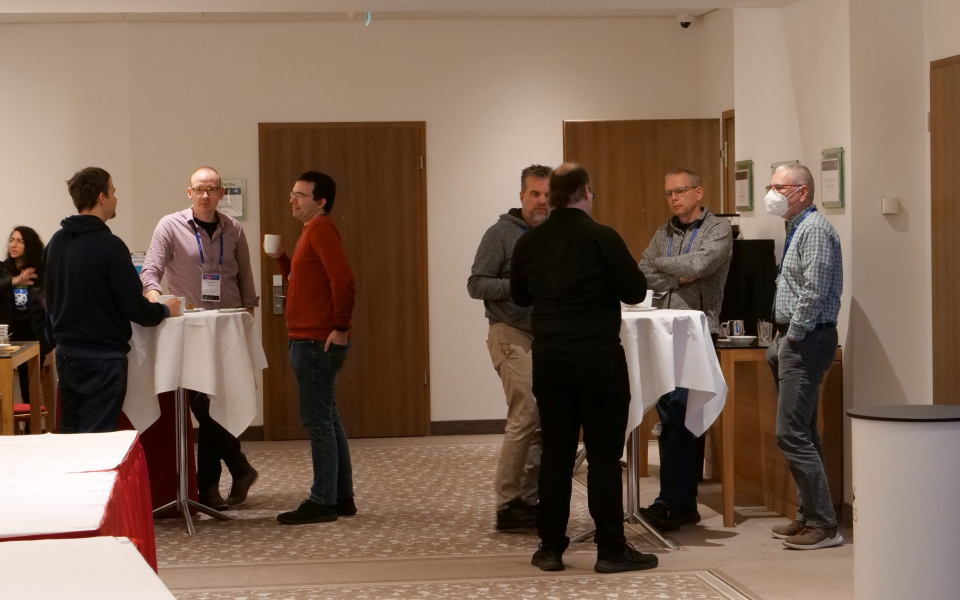
Even tough today the OSMC 2022 started with the three workshops the work to set-up the conference are still going. The team of NETWAYS Event Services (NES) are busy organizing the different sites to ensure everything is running smoothly the next two days.
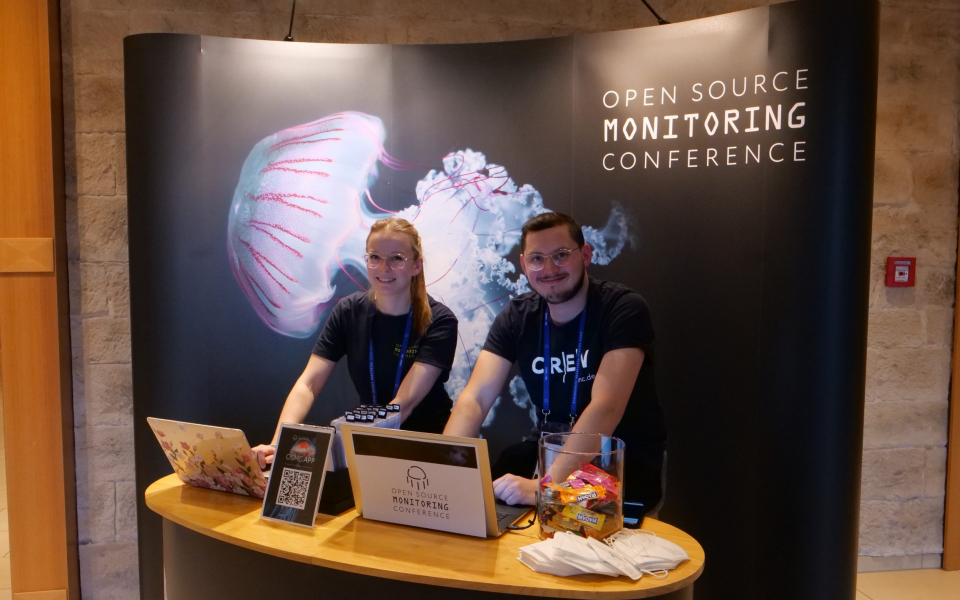
Apart from me as todays blogger and NES there is also our marketing team around. Since 9.00 o’clock this morning they are busy taking pictures and videos, while helping at the check-in counter. So if you see some of their content in your social media feed be sure to like and subscribe.
If you post pictures of your attendance at the OSMC 2022 online don’t forget to use our official hashtag #OSMC to possibly get a repost from our official channels.
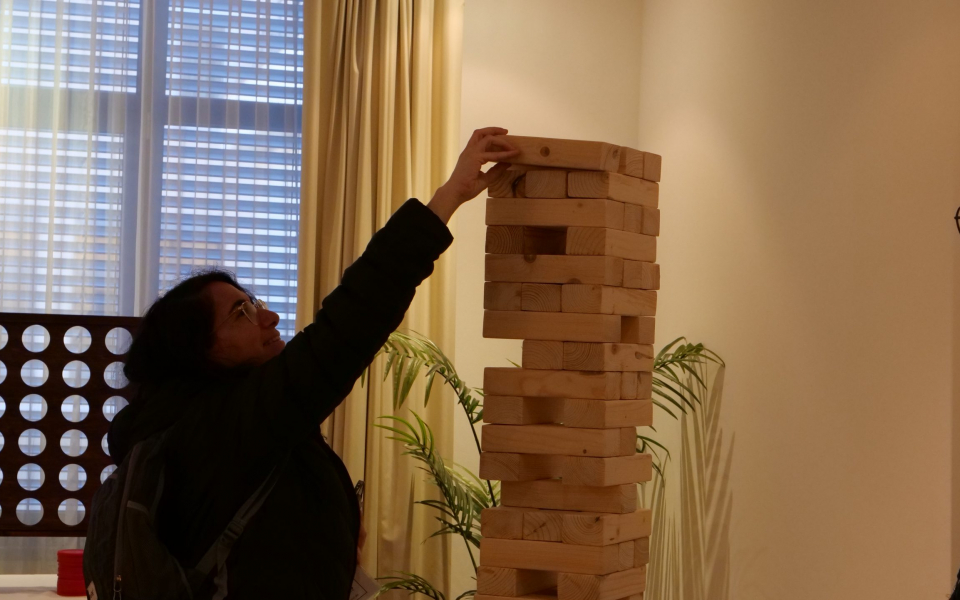
There is one feature of this years OSMC I’ve kept till the end: our new Activity Area! Here you can challenge other attendees at giant Connect four and giant Jenga as well as relax between the talks. We have one last surprise in store for you, but this one you have to see for yourself at the Open Source Monitoring Conference 2022 at the Holiday Inn Conference Hotel here in Nuremberg.
To get a few impressions of the first OSMC day I have prepared a slider with lots of awesome pictures of the first conference day. Enjoy! 😄


0 Kommentare